Immigrants from Latin America vs West Indian Median Household Income
COMPARE
Immigrants from Latin America
West Indian
Median Household Income
Median Household Income Comparison
Immigrants from Latin America
West Indians
$75,420
MEDIAN HOUSEHOLD INCOME
0.2/ 100
METRIC RATING
276th/ 347
METRIC RANK
$78,455
MEDIAN HOUSEHOLD INCOME
1.4/ 100
METRIC RATING
249th/ 347
METRIC RANK
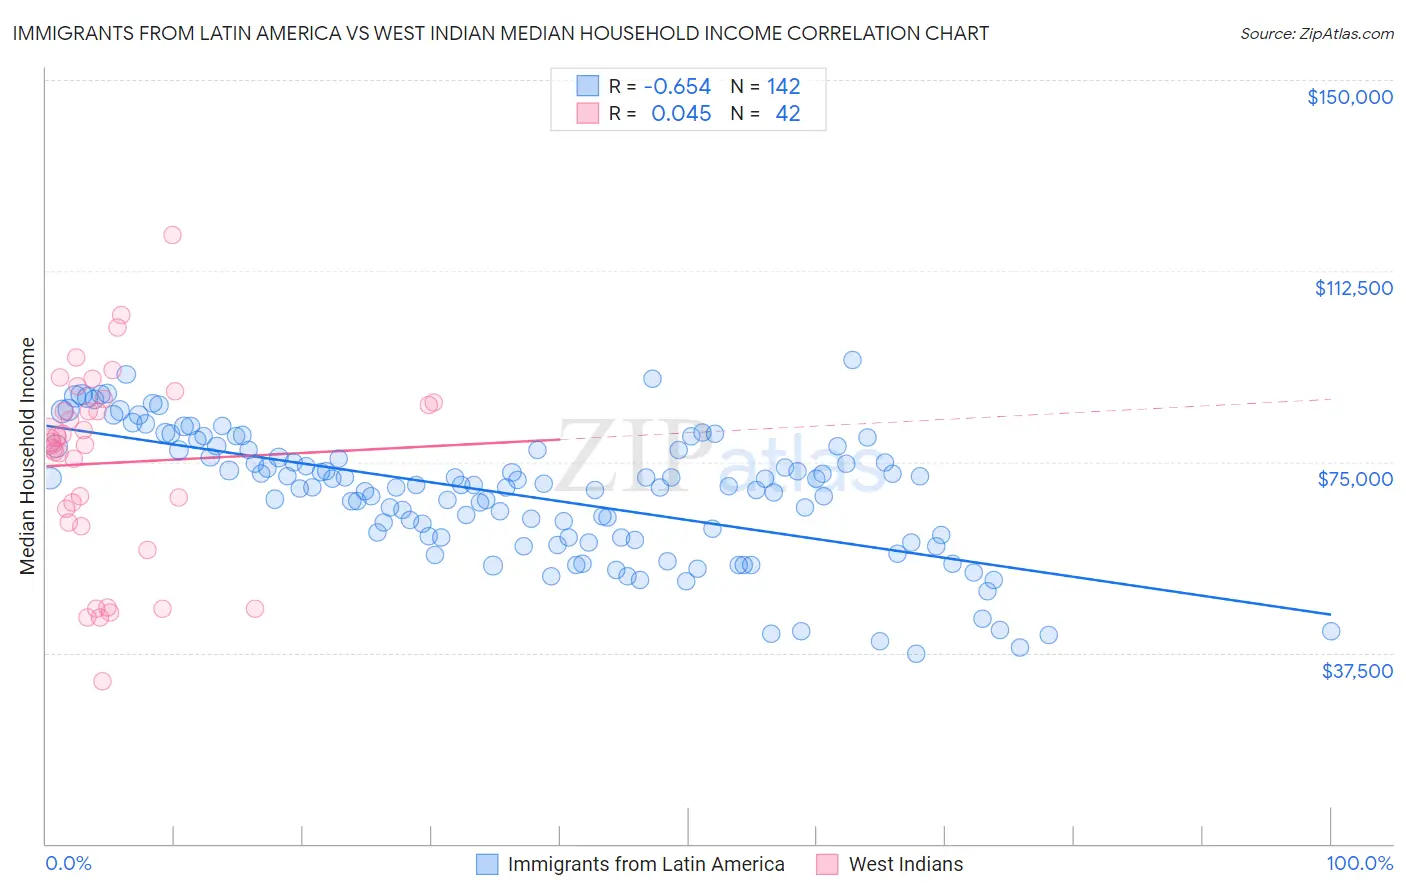
Immigrants from Latin America vs West Indian Median Household Income Correlation Chart
The statistical analysis conducted on geographies consisting of 557,585,131 people shows a significant negative correlation between the proportion of Immigrants from Latin America and median household income in the United States with a correlation coefficient (R) of -0.654 and weighted average of $75,420. Similarly, the statistical analysis conducted on geographies consisting of 253,821,014 people shows no correlation between the proportion of West Indians and median household income in the United States with a correlation coefficient (R) of 0.045 and weighted average of $78,455, a difference of 4.0%.
Median Household Income Correlation Summary
| Measurement | Immigrants from Latin America | West Indian |
| Minimum | $37,370 | $31,916 |
| Maximum | $94,905 | $119,474 |
| Range | $57,535 | $87,558 |
| Mean | $68,616 | $74,809 |
| Median | $70,288 | $79,024 |
| Interquartile 25% (IQ1) | $60,228 | $62,987 |
| Interquartile 75% (IQ3) | $77,376 | $86,556 |
| Interquartile Range (IQR) | $17,148 | $23,569 |
| Standard Deviation (Sample) | $12,455 | $19,069 |
| Standard Deviation (Population) | $12,411 | $18,840 |
Similar Demographics by Median Household Income
Demographics Similar to Immigrants from Latin America by Median Household Income
In terms of median household income, the demographic groups most similar to Immigrants from Latin America are Spanish American ($75,386, a difference of 0.040%), Immigrants from Micronesia ($75,574, a difference of 0.20%), Osage ($75,240, a difference of 0.24%), British West Indian ($75,647, a difference of 0.30%), and Liberian ($75,667, a difference of 0.33%).
| Demographics | Rating | Rank | Median Household Income |
| Cape Verdeans | 0.3 /100 | #269 | Tragic $75,848 |
| Hmong | 0.3 /100 | #270 | Tragic $75,839 |
| Pennsylvania Germans | 0.3 /100 | #271 | Tragic $75,814 |
| Somalis | 0.3 /100 | #272 | Tragic $75,782 |
| Liberians | 0.2 /100 | #273 | Tragic $75,667 |
| British West Indians | 0.2 /100 | #274 | Tragic $75,647 |
| Immigrants | Micronesia | 0.2 /100 | #275 | Tragic $75,574 |
| Immigrants | Latin America | 0.2 /100 | #276 | Tragic $75,420 |
| Spanish Americans | 0.2 /100 | #277 | Tragic $75,386 |
| Osage | 0.2 /100 | #278 | Tragic $75,240 |
| Immigrants | Guatemala | 0.2 /100 | #279 | Tragic $75,123 |
| Senegalese | 0.2 /100 | #280 | Tragic $74,999 |
| Immigrants | Liberia | 0.1 /100 | #281 | Tragic $74,896 |
| Central American Indians | 0.1 /100 | #282 | Tragic $74,847 |
| Cree | 0.1 /100 | #283 | Tragic $74,685 |
Demographics Similar to West Indians by Median Household Income
In terms of median household income, the demographic groups most similar to West Indians are Sudanese ($78,529, a difference of 0.090%), Immigrants from Laos ($78,327, a difference of 0.16%), Immigrants from Burma/Myanmar ($78,682, a difference of 0.29%), Mexican American Indian ($78,166, a difference of 0.37%), and Central American ($78,803, a difference of 0.44%).
| Demographics | Rating | Rank | Median Household Income |
| Immigrants | Sudan | 2.1 /100 | #242 | Tragic $79,103 |
| Immigrants | Barbados | 1.9 /100 | #243 | Tragic $78,989 |
| Marshallese | 1.9 /100 | #244 | Tragic $78,930 |
| Inupiat | 1.8 /100 | #245 | Tragic $78,841 |
| Central Americans | 1.7 /100 | #246 | Tragic $78,803 |
| Immigrants | Burma/Myanmar | 1.6 /100 | #247 | Tragic $78,682 |
| Sudanese | 1.5 /100 | #248 | Tragic $78,529 |
| West Indians | 1.4 /100 | #249 | Tragic $78,455 |
| Immigrants | Laos | 1.3 /100 | #250 | Tragic $78,327 |
| Mexican American Indians | 1.2 /100 | #251 | Tragic $78,166 |
| Immigrants | West Indies | 1.0 /100 | #252 | Tragic $77,956 |
| Immigrants | St. Vincent and the Grenadines | 0.9 /100 | #253 | Tragic $77,690 |
| Sub-Saharan Africans | 0.8 /100 | #254 | Tragic $77,631 |
| Immigrants | Middle Africa | 0.8 /100 | #255 | Tragic $77,559 |
| Belizeans | 0.6 /100 | #256 | Tragic $77,028 |