Immigrants from Latin America vs French American Indian Median Household Income
COMPARE
Immigrants from Latin America
French American Indian
Median Household Income
Median Household Income Comparison
Immigrants from Latin America
French American Indians
$75,420
MEDIAN HOUSEHOLD INCOME
0.2/ 100
METRIC RATING
276th/ 347
METRIC RANK
$76,387
MEDIAN HOUSEHOLD INCOME
0.4/ 100
METRIC RATING
262nd/ 347
METRIC RANK
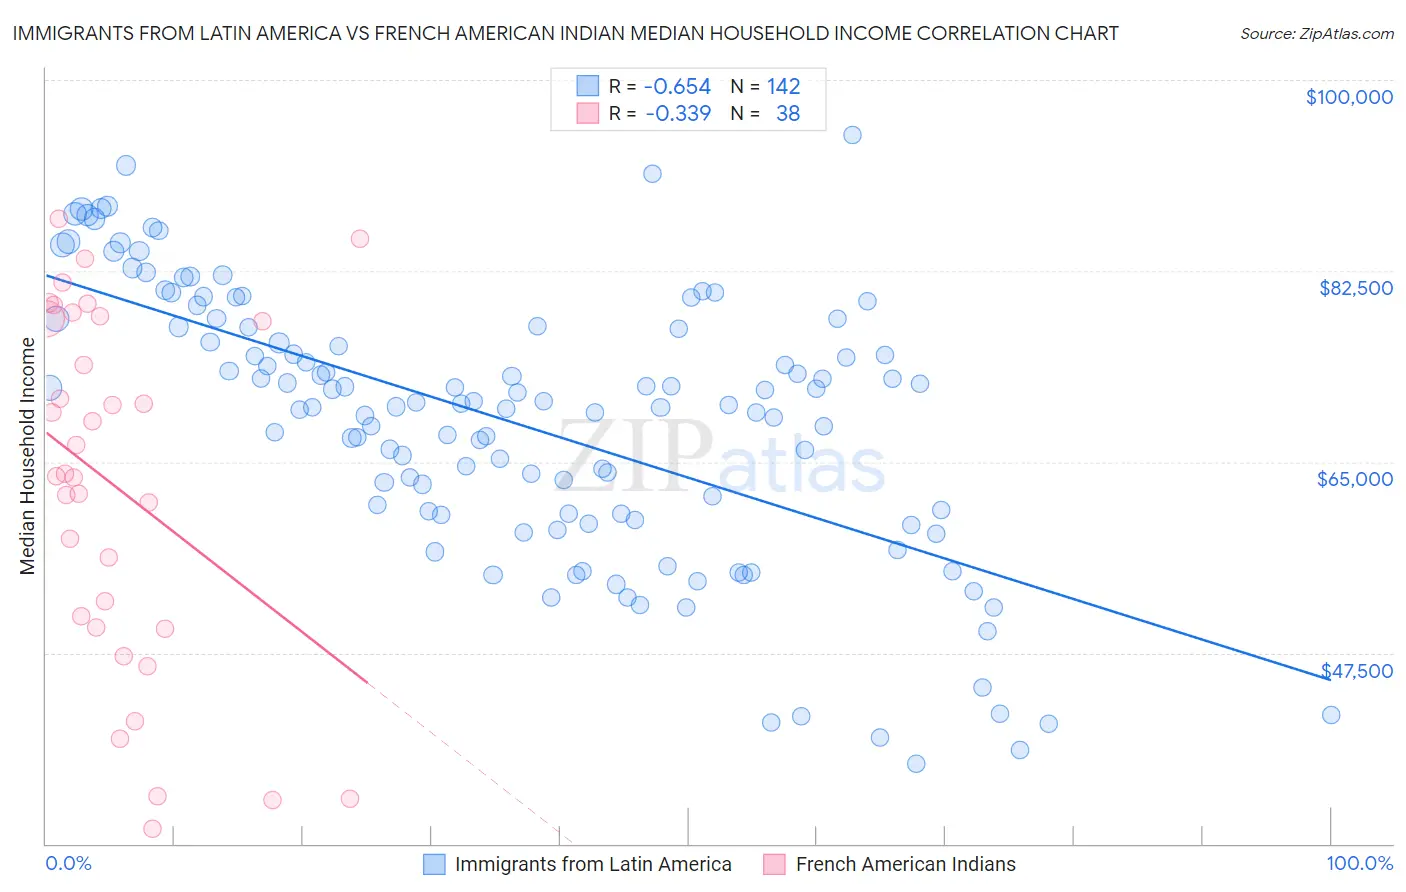
Immigrants from Latin America vs French American Indian Median Household Income Correlation Chart
The statistical analysis conducted on geographies consisting of 557,585,131 people shows a significant negative correlation between the proportion of Immigrants from Latin America and median household income in the United States with a correlation coefficient (R) of -0.654 and weighted average of $75,420. Similarly, the statistical analysis conducted on geographies consisting of 131,952,383 people shows a mild negative correlation between the proportion of French American Indians and median household income in the United States with a correlation coefficient (R) of -0.339 and weighted average of $76,387, a difference of 1.3%.
Median Household Income Correlation Summary
| Measurement | Immigrants from Latin America | French American Indian |
| Minimum | $37,370 | $31,325 |
| Maximum | $94,905 | $87,295 |
| Range | $57,535 | $55,970 |
| Mean | $68,616 | $62,652 |
| Median | $70,288 | $63,795 |
| Interquartile 25% (IQ1) | $60,228 | $49,785 |
| Interquartile 75% (IQ3) | $77,376 | $78,132 |
| Interquartile Range (IQR) | $17,148 | $28,346 |
| Standard Deviation (Sample) | $12,455 | $16,205 |
| Standard Deviation (Population) | $12,411 | $15,990 |
Demographics Similar to Immigrants from Latin America and French American Indians by Median Household Income
In terms of median household income, the demographic groups most similar to Immigrants from Latin America are Spanish American ($75,386, a difference of 0.040%), Immigrants from Micronesia ($75,574, a difference of 0.20%), Osage ($75,240, a difference of 0.24%), British West Indian ($75,647, a difference of 0.30%), and Liberian ($75,667, a difference of 0.33%). Similarly, the demographic groups most similar to French American Indians are Alaskan Athabascan ($76,383, a difference of 0.010%), Immigrants from Grenada ($76,517, a difference of 0.17%), Jamaican ($76,583, a difference of 0.26%), Spanish American Indian ($76,670, a difference of 0.37%), and Guatemalan ($75,961, a difference of 0.56%).
| Demographics | Rating | Rank | Median Household Income |
| Spanish American Indians | 0.4 /100 | #259 | Tragic $76,670 |
| Jamaicans | 0.4 /100 | #260 | Tragic $76,583 |
| Immigrants | Grenada | 0.4 /100 | #261 | Tragic $76,517 |
| French American Indians | 0.4 /100 | #262 | Tragic $76,387 |
| Alaskan Athabascans | 0.4 /100 | #263 | Tragic $76,383 |
| Guatemalans | 0.3 /100 | #264 | Tragic $75,961 |
| Immigrants | Belize | 0.3 /100 | #265 | Tragic $75,938 |
| Americans | 0.3 /100 | #266 | Tragic $75,932 |
| German Russians | 0.3 /100 | #267 | Tragic $75,856 |
| Immigrants | Jamaica | 0.3 /100 | #268 | Tragic $75,851 |
| Cape Verdeans | 0.3 /100 | #269 | Tragic $75,848 |
| Hmong | 0.3 /100 | #270 | Tragic $75,839 |
| Pennsylvania Germans | 0.3 /100 | #271 | Tragic $75,814 |
| Somalis | 0.3 /100 | #272 | Tragic $75,782 |
| Liberians | 0.2 /100 | #273 | Tragic $75,667 |
| British West Indians | 0.2 /100 | #274 | Tragic $75,647 |
| Immigrants | Micronesia | 0.2 /100 | #275 | Tragic $75,574 |
| Immigrants | Latin America | 0.2 /100 | #276 | Tragic $75,420 |
| Spanish Americans | 0.2 /100 | #277 | Tragic $75,386 |
| Osage | 0.2 /100 | #278 | Tragic $75,240 |
| Immigrants | Guatemala | 0.2 /100 | #279 | Tragic $75,123 |