Immigrants from Israel vs Hmong Wage/Income Gap
COMPARE
Immigrants from Israel
Hmong
Wage/Income Gap
Wage/Income Gap Comparison
Immigrants from Israel
Hmong
28.2%
WAGE/INCOME GAP
0.3/ 100
METRIC RATING
293rd/ 347
METRIC RANK
27.7%
WAGE/INCOME GAP
1.0/ 100
METRIC RATING
266th/ 347
METRIC RANK
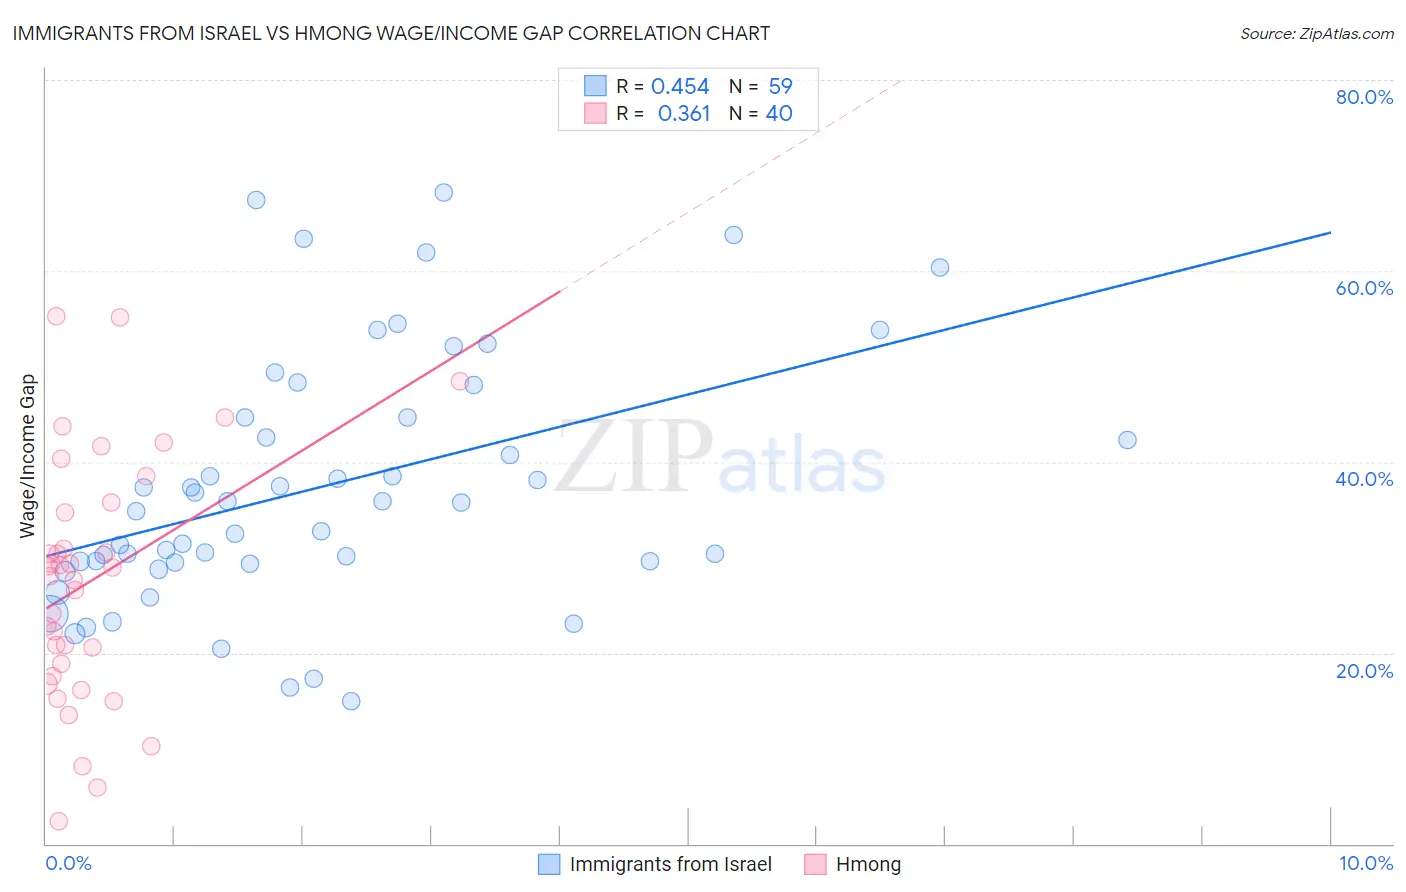
Immigrants from Israel vs Hmong Wage/Income Gap Correlation Chart
The statistical analysis conducted on geographies consisting of 209,965,459 people shows a moderate positive correlation between the proportion of Immigrants from Israel and wage/income gap percentage in the United States with a correlation coefficient (R) of 0.454 and weighted average of 28.2%. Similarly, the statistical analysis conducted on geographies consisting of 24,681,537 people shows a mild positive correlation between the proportion of Hmong and wage/income gap percentage in the United States with a correlation coefficient (R) of 0.361 and weighted average of 27.7%, a difference of 2.0%.
Wage/Income Gap Correlation Summary
| Measurement | Immigrants from Israel | Hmong |
| Minimum | 15.0% | 2.4% |
| Maximum | 68.2% | 55.2% |
| Range | 53.2% | 52.9% |
| Mean | 37.4% | 27.5% |
| Median | 35.8% | 28.4% |
| Interquartile 25% (IQ1) | 29.5% | 18.2% |
| Interquartile 75% (IQ3) | 44.7% | 35.2% |
| Interquartile Range (IQR) | 15.2% | 17.0% |
| Standard Deviation (Sample) | 13.1% | 12.7% |
| Standard Deviation (Population) | 13.0% | 12.6% |
Similar Demographics by Wage/Income Gap
Demographics Similar to Immigrants from Israel by Wage/Income Gap
In terms of wage/income gap, the demographic groups most similar to Immigrants from Israel are Greek (28.2%, a difference of 0.020%), Immigrants from Australia (28.2%, a difference of 0.11%), Slovene (28.3%, a difference of 0.15%), Czechoslovakian (28.2%, a difference of 0.16%), and Northern European (28.3%, a difference of 0.16%).
| Demographics | Rating | Rank | Wage/Income Gap |
| Immigrants | Austria | 0.4 /100 | #286 | Tragic 28.1% |
| Okinawans | 0.4 /100 | #287 | Tragic 28.1% |
| Choctaw | 0.4 /100 | #288 | Tragic 28.1% |
| Canadians | 0.3 /100 | #289 | Tragic 28.1% |
| Australians | 0.3 /100 | #290 | Tragic 28.2% |
| Czechoslovakians | 0.3 /100 | #291 | Tragic 28.2% |
| Immigrants | Australia | 0.3 /100 | #292 | Tragic 28.2% |
| Immigrants | Israel | 0.3 /100 | #293 | Tragic 28.2% |
| Greeks | 0.3 /100 | #294 | Tragic 28.2% |
| Slovenes | 0.3 /100 | #295 | Tragic 28.3% |
| Northern Europeans | 0.3 /100 | #296 | Tragic 28.3% |
| Immigrants | North America | 0.2 /100 | #297 | Tragic 28.4% |
| Austrians | 0.2 /100 | #298 | Tragic 28.4% |
| Immigrants | North Macedonia | 0.2 /100 | #299 | Tragic 28.4% |
| Immigrants | Northern Europe | 0.2 /100 | #300 | Tragic 28.5% |
Demographics Similar to Hmong by Wage/Income Gap
In terms of wage/income gap, the demographic groups most similar to Hmong are Serbian (27.7%, a difference of 0.0%), Immigrants from Switzerland (27.7%, a difference of 0.010%), Turkish (27.7%, a difference of 0.020%), New Zealander (27.7%, a difference of 0.10%), and Potawatomi (27.7%, a difference of 0.11%).
| Demographics | Rating | Rank | Wage/Income Gap |
| Icelanders | 1.8 /100 | #259 | Tragic 27.5% |
| Tongans | 1.7 /100 | #260 | Tragic 27.5% |
| Immigrants | Germany | 1.5 /100 | #261 | Tragic 27.5% |
| Immigrants | Lebanon | 1.5 /100 | #262 | Tragic 27.5% |
| Syrians | 1.4 /100 | #263 | Tragic 27.6% |
| Immigrants | Switzerland | 1.0 /100 | #264 | Tragic 27.7% |
| Serbians | 1.0 /100 | #265 | Tragic 27.7% |
| Hmong | 1.0 /100 | #266 | Tragic 27.7% |
| Turks | 1.0 /100 | #267 | Tragic 27.7% |
| New Zealanders | 1.0 /100 | #268 | Tragic 27.7% |
| Potawatomi | 0.9 /100 | #269 | Tragic 27.7% |
| Immigrants | Western Europe | 0.9 /100 | #270 | Tragic 27.8% |
| Ute | 0.8 /100 | #271 | Tragic 27.8% |
| Immigrants | Korea | 0.8 /100 | #272 | Tragic 27.8% |
| Bulgarians | 0.7 /100 | #273 | Tragic 27.8% |