Immigrants from Israel vs South American Indian Unemployment Among Ages 45 to 54 years
COMPARE
Immigrants from Israel
South American Indian
Unemployment Among Ages 45 to 54 years
Unemployment Among Ages 45 to 54 years Comparison
Immigrants from Israel
South American Indians
4.7%
UNEMPLOYMENT AMONG AGES 45 TO 54 YEARS
3.0/ 100
METRIC RATING
229th/ 347
METRIC RANK
4.7%
UNEMPLOYMENT AMONG AGES 45 TO 54 YEARS
3.1/ 100
METRIC RATING
228th/ 347
METRIC RANK
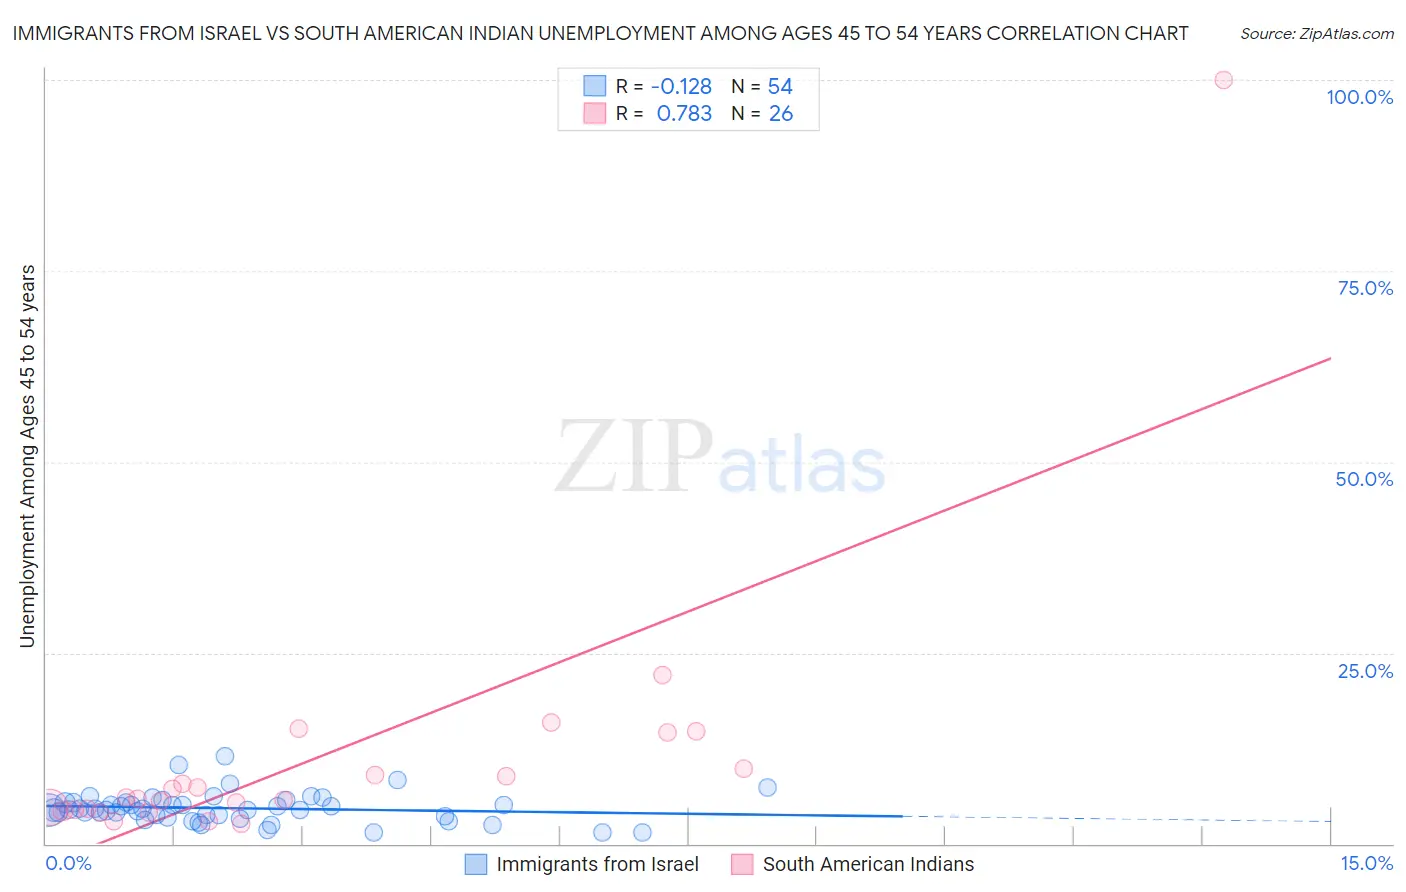
Immigrants from Israel vs South American Indian Unemployment Among Ages 45 to 54 years Correlation Chart
The statistical analysis conducted on geographies consisting of 207,748,012 people shows a poor negative correlation between the proportion of Immigrants from Israel and unemployment rate among population between the ages 45 and 54 in the United States with a correlation coefficient (R) of -0.128 and weighted average of 4.7%. Similarly, the statistical analysis conducted on geographies consisting of 163,218,940 people shows a strong positive correlation between the proportion of South American Indians and unemployment rate among population between the ages 45 and 54 in the United States with a correlation coefficient (R) of 0.783 and weighted average of 4.7%, a difference of 0.050%.
Unemployment Among Ages 45 to 54 years Correlation Summary
| Measurement | Immigrants from Israel | South American Indian |
| Minimum | 1.4% | 2.6% |
| Maximum | 11.5% | 100.0% |
| Range | 10.1% | 97.4% |
| Mean | 4.7% | 11.4% |
| Median | 4.5% | 5.9% |
| Interquartile 25% (IQ1) | 3.6% | 4.5% |
| Interquartile 75% (IQ3) | 5.4% | 9.8% |
| Interquartile Range (IQR) | 1.8% | 5.3% |
| Standard Deviation (Sample) | 1.9% | 18.7% |
| Standard Deviation (Population) | 1.9% | 18.3% |
Demographics Similar to Immigrants from Israel and South American Indians by Unemployment Among Ages 45 to 54 years
In terms of unemployment among ages 45 to 54 years, the demographic groups most similar to Immigrants from Israel are Iraqi (4.7%, a difference of 0.080%), Japanese (4.7%, a difference of 0.080%), Immigrants from Ireland (4.7%, a difference of 0.12%), Ottawa (4.7%, a difference of 0.12%), and Immigrants (4.7%, a difference of 0.16%). Similarly, the demographic groups most similar to South American Indians are Iraqi (4.7%, a difference of 0.030%), Assyrian/Chaldean/Syriac (4.7%, a difference of 0.12%), Japanese (4.7%, a difference of 0.13%), Immigrants from Ireland (4.7%, a difference of 0.16%), and Ottawa (4.7%, a difference of 0.17%).
| Demographics | Rating | Rank | Unemployment Among Ages 45 to 54 years |
| Immigrants | Uganda | 7.1 /100 | #218 | Tragic 4.7% |
| Nigerians | 7.0 /100 | #219 | Tragic 4.7% |
| Guamanians/Chamorros | 6.8 /100 | #220 | Tragic 4.7% |
| Choctaw | 6.1 /100 | #221 | Tragic 4.7% |
| Immigrants | Southern Europe | 6.0 /100 | #222 | Tragic 4.7% |
| Potawatomi | 5.7 /100 | #223 | Tragic 4.7% |
| Comanche | 4.8 /100 | #224 | Tragic 4.7% |
| Immigrants | Norway | 4.8 /100 | #225 | Tragic 4.7% |
| Assyrians/Chaldeans/Syriacs | 3.5 /100 | #226 | Tragic 4.7% |
| Iraqis | 3.2 /100 | #227 | Tragic 4.7% |
| South American Indians | 3.1 /100 | #228 | Tragic 4.7% |
| Immigrants | Israel | 3.0 /100 | #229 | Tragic 4.7% |
| Japanese | 2.8 /100 | #230 | Tragic 4.7% |
| Immigrants | Ireland | 2.7 /100 | #231 | Tragic 4.7% |
| Ottawa | 2.7 /100 | #232 | Tragic 4.7% |
| Immigrants | Immigrants | 2.6 /100 | #233 | Tragic 4.7% |
| Soviet Union | 2.6 /100 | #234 | Tragic 4.7% |
| Cree | 2.3 /100 | #235 | Tragic 4.7% |
| Tlingit-Haida | 2.3 /100 | #236 | Tragic 4.7% |
| Alsatians | 1.6 /100 | #237 | Tragic 4.7% |
| Yaqui | 1.4 /100 | #238 | Tragic 4.7% |