Immigrants from Haiti vs Soviet Union Median Male Earnings
COMPARE
Immigrants from Haiti
Soviet Union
Median Male Earnings
Median Male Earnings Comparison
Immigrants from Haiti
Soviet Union
$45,266
MEDIAN MALE EARNINGS
0.0/ 100
METRIC RATING
326th/ 347
METRIC RANK
$63,382
MEDIAN MALE EARNINGS
100.0/ 100
METRIC RATING
32nd/ 347
METRIC RANK
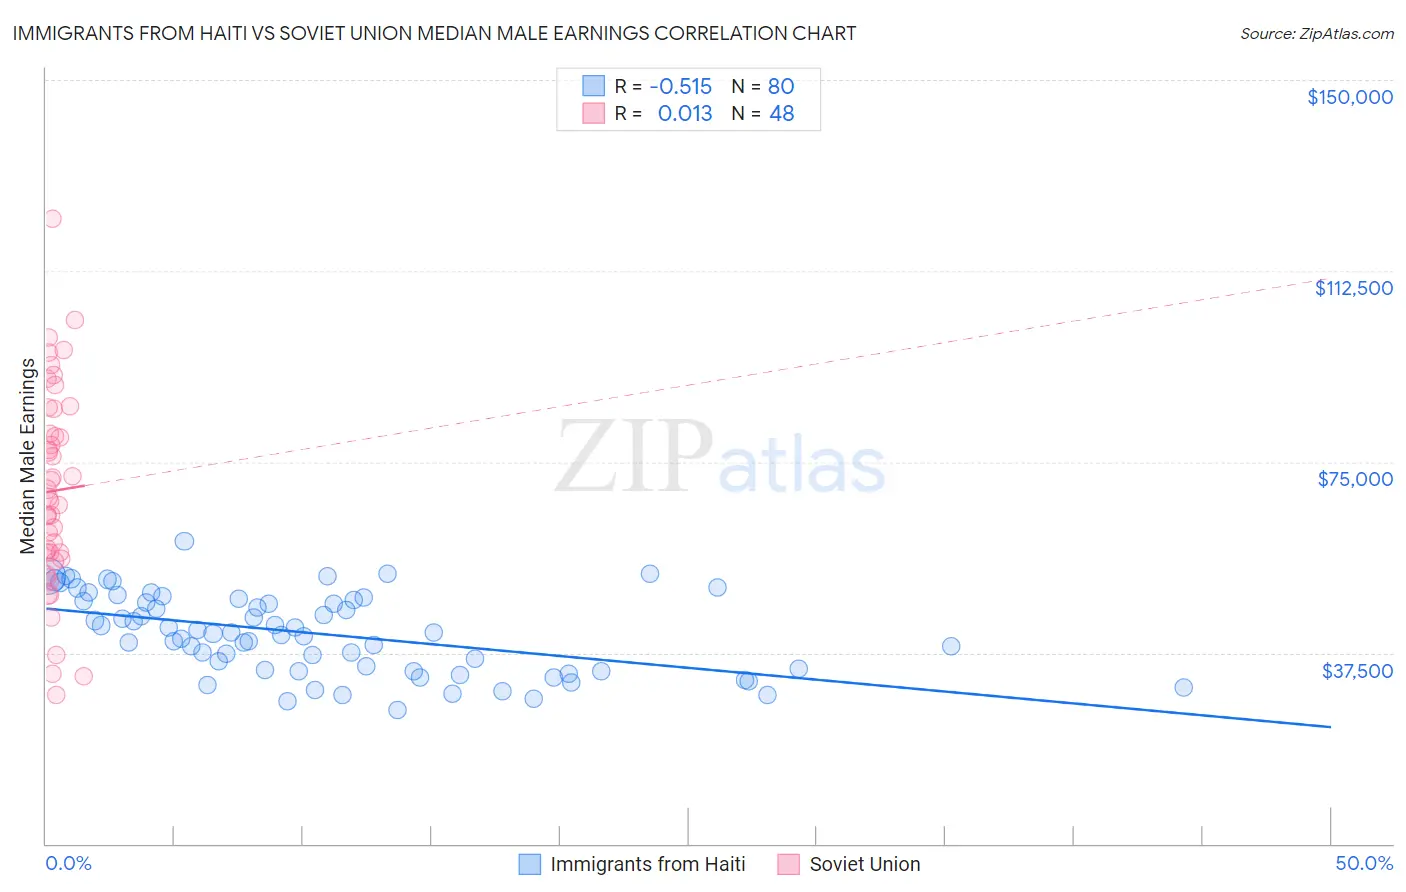
Immigrants from Haiti vs Soviet Union Median Male Earnings Correlation Chart
The statistical analysis conducted on geographies consisting of 225,244,233 people shows a substantial negative correlation between the proportion of Immigrants from Haiti and median male earnings in the United States with a correlation coefficient (R) of -0.515 and weighted average of $45,266. Similarly, the statistical analysis conducted on geographies consisting of 43,507,869 people shows no correlation between the proportion of Soviet Union and median male earnings in the United States with a correlation coefficient (R) of 0.013 and weighted average of $63,382, a difference of 40.0%.
Median Male Earnings Correlation Summary
| Measurement | Immigrants from Haiti | Soviet Union |
| Minimum | $26,317 | $29,197 |
| Maximum | $59,316 | $122,813 |
| Range | $32,999 | $93,616 |
| Mean | $41,227 | $69,321 |
| Median | $41,309 | $67,564 |
| Interquartile 25% (IQ1) | $34,055 | $56,498 |
| Interquartile 75% (IQ3) | $47,765 | $82,953 |
| Interquartile Range (IQR) | $13,710 | $26,455 |
| Standard Deviation (Sample) | $7,780 | $19,957 |
| Standard Deviation (Population) | $7,731 | $19,748 |
Similar Demographics by Median Male Earnings
Demographics Similar to Immigrants from Haiti by Median Male Earnings
In terms of median male earnings, the demographic groups most similar to Immigrants from Haiti are Immigrants from Bahamas ($45,176, a difference of 0.20%), Kiowa ($45,094, a difference of 0.38%), Yuman ($45,446, a difference of 0.40%), Black/African American ($45,523, a difference of 0.57%), and Yakama ($45,002, a difference of 0.59%).
| Demographics | Rating | Rank | Median Male Earnings |
| Haitians | 0.0 /100 | #319 | Tragic $45,903 |
| Immigrants | Honduras | 0.0 /100 | #320 | Tragic $45,787 |
| Fijians | 0.0 /100 | #321 | Tragic $45,607 |
| Sioux | 0.0 /100 | #322 | Tragic $45,566 |
| Immigrants | Central America | 0.0 /100 | #323 | Tragic $45,538 |
| Blacks/African Americans | 0.0 /100 | #324 | Tragic $45,523 |
| Yuman | 0.0 /100 | #325 | Tragic $45,446 |
| Immigrants | Haiti | 0.0 /100 | #326 | Tragic $45,266 |
| Immigrants | Bahamas | 0.0 /100 | #327 | Tragic $45,176 |
| Kiowa | 0.0 /100 | #328 | Tragic $45,094 |
| Yakama | 0.0 /100 | #329 | Tragic $45,002 |
| Immigrants | Mexico | 0.0 /100 | #330 | Tragic $44,960 |
| Natives/Alaskans | 0.0 /100 | #331 | Tragic $44,775 |
| Bahamians | 0.0 /100 | #332 | Tragic $44,756 |
| Immigrants | Congo | 0.0 /100 | #333 | Tragic $44,204 |
Demographics Similar to Soviet Union by Median Male Earnings
In terms of median male earnings, the demographic groups most similar to Soviet Union are Immigrants from Lithuania ($63,346, a difference of 0.060%), Immigrants from Russia ($63,326, a difference of 0.090%), Latvian ($63,498, a difference of 0.18%), Immigrants from Asia ($63,240, a difference of 0.22%), and Israeli ($63,228, a difference of 0.24%).
| Demographics | Rating | Rank | Median Male Earnings |
| Immigrants | Denmark | 100.0 /100 | #25 | Exceptional $64,625 |
| Turks | 100.0 /100 | #26 | Exceptional $64,253 |
| Immigrants | Switzerland | 100.0 /100 | #27 | Exceptional $63,944 |
| Russians | 100.0 /100 | #28 | Exceptional $63,939 |
| Asians | 100.0 /100 | #29 | Exceptional $63,827 |
| Immigrants | France | 100.0 /100 | #30 | Exceptional $63,715 |
| Latvians | 100.0 /100 | #31 | Exceptional $63,498 |
| Soviet Union | 100.0 /100 | #32 | Exceptional $63,382 |
| Immigrants | Lithuania | 100.0 /100 | #33 | Exceptional $63,346 |
| Immigrants | Russia | 100.0 /100 | #34 | Exceptional $63,326 |
| Immigrants | Asia | 100.0 /100 | #35 | Exceptional $63,240 |
| Israelis | 100.0 /100 | #36 | Exceptional $63,228 |
| Immigrants | Sri Lanka | 100.0 /100 | #37 | Exceptional $63,099 |
| Maltese | 100.0 /100 | #38 | Exceptional $62,953 |
| Immigrants | South Africa | 100.0 /100 | #39 | Exceptional $62,899 |