Immigrants from Haiti vs Soviet Union Doctorate Degree
COMPARE
Immigrants from Haiti
Soviet Union
Doctorate Degree
Doctorate Degree Comparison
Immigrants from Haiti
Soviet Union
1.3%
DOCTORATE DEGREE
0.0/ 100
METRIC RATING
335th/ 347
METRIC RANK
2.5%
DOCTORATE DEGREE
100.0/ 100
METRIC RATING
43rd/ 347
METRIC RANK
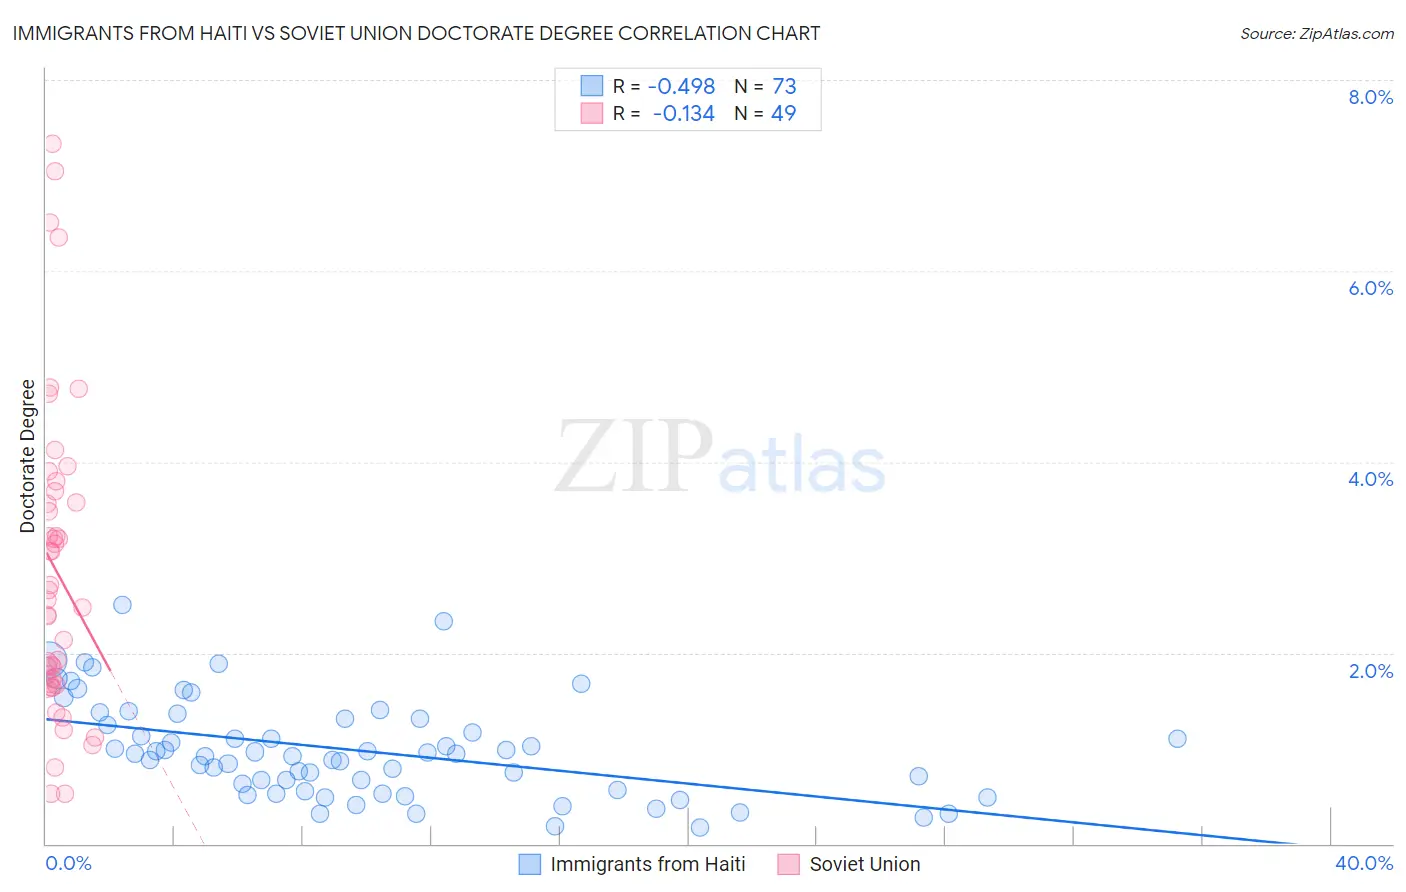
Immigrants from Haiti vs Soviet Union Doctorate Degree Correlation Chart
The statistical analysis conducted on geographies consisting of 224,109,380 people shows a moderate negative correlation between the proportion of Immigrants from Haiti and percentage of population with at least doctorate degree education in the United States with a correlation coefficient (R) of -0.498 and weighted average of 1.3%. Similarly, the statistical analysis conducted on geographies consisting of 43,500,474 people shows a poor negative correlation between the proportion of Soviet Union and percentage of population with at least doctorate degree education in the United States with a correlation coefficient (R) of -0.134 and weighted average of 2.5%, a difference of 97.5%.
Doctorate Degree Correlation Summary
| Measurement | Immigrants from Haiti | Soviet Union |
| Minimum | 0.17% | 0.52% |
| Maximum | 2.5% | 7.3% |
| Range | 2.3% | 6.8% |
| Mean | 0.98% | 2.9% |
| Median | 0.94% | 2.5% |
| Interquartile 25% (IQ1) | 0.56% | 1.7% |
| Interquartile 75% (IQ3) | 1.3% | 3.6% |
| Interquartile Range (IQR) | 0.75% | 2.0% |
| Standard Deviation (Sample) | 0.51% | 1.6% |
| Standard Deviation (Population) | 0.51% | 1.6% |
Similar Demographics by Doctorate Degree
Demographics Similar to Immigrants from Haiti by Doctorate Degree
In terms of doctorate degree, the demographic groups most similar to Immigrants from Haiti are Nepalese (1.3%, a difference of 0.23%), Immigrants from Dominican Republic (1.3%, a difference of 1.8%), Immigrants from Caribbean (1.3%, a difference of 2.0%), Yakama (1.3%, a difference of 2.1%), and Bangladeshi (1.2%, a difference of 3.7%).
| Demographics | Rating | Rank | Doctorate Degree |
| Inupiat | 0.0 /100 | #328 | Tragic 1.3% |
| Haitians | 0.0 /100 | #329 | Tragic 1.3% |
| Yup'ik | 0.0 /100 | #330 | Tragic 1.3% |
| Immigrants | Latin America | 0.0 /100 | #331 | Tragic 1.3% |
| Yakama | 0.0 /100 | #332 | Tragic 1.3% |
| Immigrants | Caribbean | 0.0 /100 | #333 | Tragic 1.3% |
| Immigrants | Dominican Republic | 0.0 /100 | #334 | Tragic 1.3% |
| Immigrants | Haiti | 0.0 /100 | #335 | Tragic 1.3% |
| Nepalese | 0.0 /100 | #336 | Tragic 1.3% |
| Bangladeshis | 0.0 /100 | #337 | Tragic 1.2% |
| Puget Sound Salish | 0.0 /100 | #338 | Tragic 1.2% |
| Immigrants | Central America | 0.0 /100 | #339 | Tragic 1.2% |
| Immigrants | Cuba | 0.0 /100 | #340 | Tragic 1.2% |
| Mexicans | 0.0 /100 | #341 | Tragic 1.2% |
| Arapaho | 0.0 /100 | #342 | Tragic 1.2% |
Demographics Similar to Soviet Union by Doctorate Degree
In terms of doctorate degree, the demographic groups most similar to Soviet Union are Immigrants from Netherlands (2.5%, a difference of 0.040%), New Zealander (2.5%, a difference of 0.94%), Immigrants from South Africa (2.4%, a difference of 1.5%), Immigrants from Russia (2.5%, a difference of 1.6%), and Immigrants from Austria (2.4%, a difference of 1.7%).
| Demographics | Rating | Rank | Doctorate Degree |
| Immigrants | Spain | 100.0 /100 | #36 | Exceptional 2.6% |
| Immigrants | Kuwait | 100.0 /100 | #37 | Exceptional 2.6% |
| Russians | 100.0 /100 | #38 | Exceptional 2.6% |
| Immigrants | Ireland | 100.0 /100 | #39 | Exceptional 2.5% |
| Estonians | 100.0 /100 | #40 | Exceptional 2.5% |
| Immigrants | Russia | 100.0 /100 | #41 | Exceptional 2.5% |
| New Zealanders | 100.0 /100 | #42 | Exceptional 2.5% |
| Soviet Union | 100.0 /100 | #43 | Exceptional 2.5% |
| Immigrants | Netherlands | 100.0 /100 | #44 | Exceptional 2.5% |
| Immigrants | South Africa | 100.0 /100 | #45 | Exceptional 2.4% |
| Immigrants | Austria | 100.0 /100 | #46 | Exceptional 2.4% |
| Immigrants | Western Europe | 100.0 /100 | #47 | Exceptional 2.4% |
| Asians | 100.0 /100 | #48 | Exceptional 2.4% |
| Immigrants | Asia | 100.0 /100 | #49 | Exceptional 2.4% |
| Immigrants | Norway | 100.0 /100 | #50 | Exceptional 2.4% |