Immigrants from Haiti vs Tsimshian Median Earnings
COMPARE
Immigrants from Haiti
Tsimshian
Median Earnings
Median Earnings Comparison
Immigrants from Haiti
Tsimshian
$40,550
MEDIAN EARNINGS
0.0/ 100
METRIC RATING
309th/ 347
METRIC RANK
$43,695
MEDIAN EARNINGS
2.1/ 100
METRIC RATING
251st/ 347
METRIC RANK
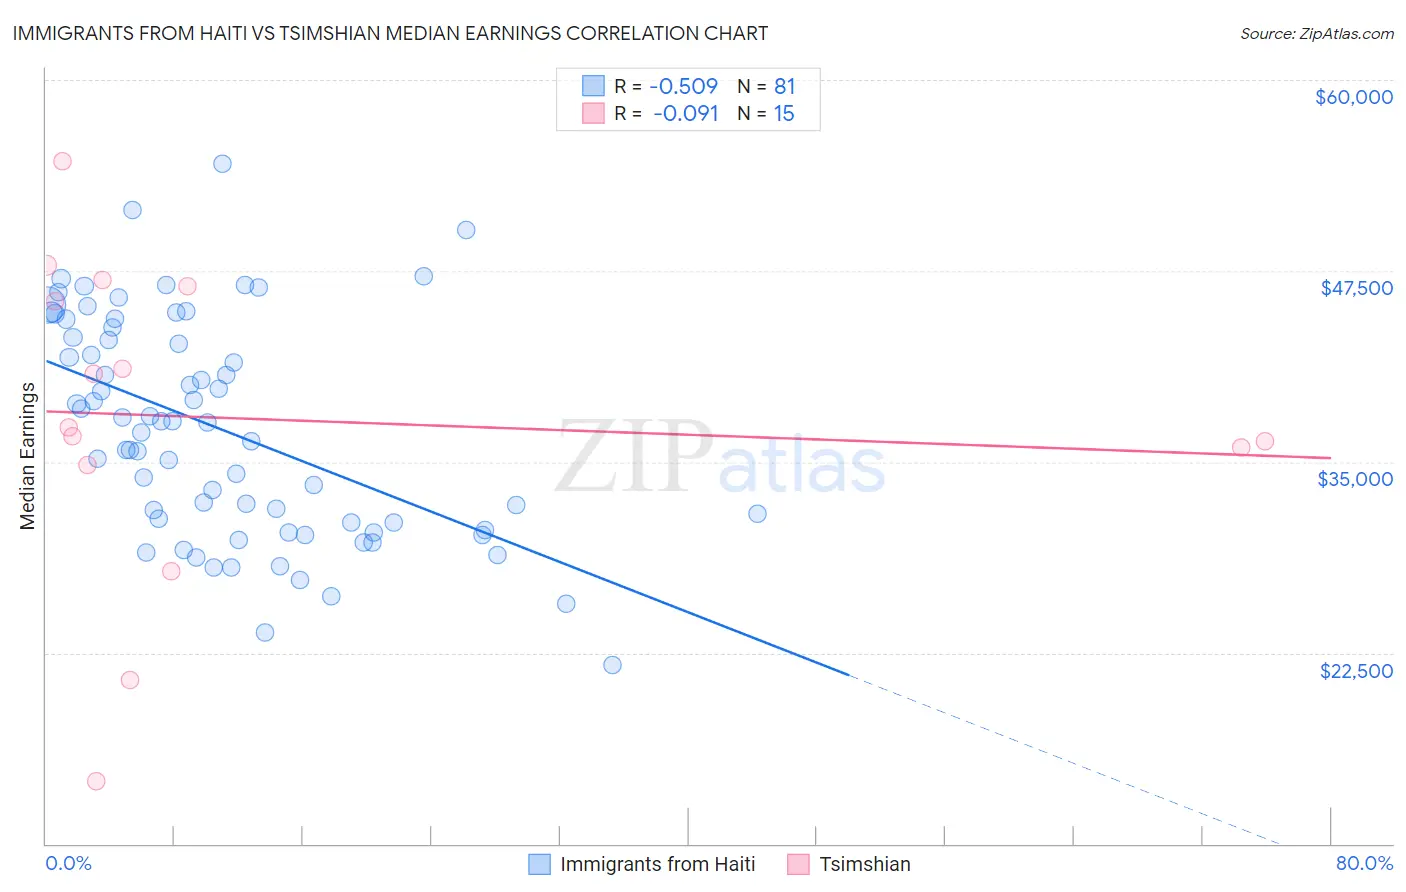
Immigrants from Haiti vs Tsimshian Median Earnings Correlation Chart
The statistical analysis conducted on geographies consisting of 225,267,709 people shows a substantial negative correlation between the proportion of Immigrants from Haiti and median earnings in the United States with a correlation coefficient (R) of -0.509 and weighted average of $40,550. Similarly, the statistical analysis conducted on geographies consisting of 15,626,544 people shows a slight negative correlation between the proportion of Tsimshian and median earnings in the United States with a correlation coefficient (R) of -0.091 and weighted average of $43,695, a difference of 7.8%.
Median Earnings Correlation Summary
| Measurement | Immigrants from Haiti | Tsimshian |
| Minimum | $21,741 | $14,091 |
| Maximum | $54,545 | $54,691 |
| Range | $32,804 | $40,600 |
| Mean | $37,122 | $37,810 |
| Median | $37,540 | $37,241 |
| Interquartile 25% (IQ1) | $30,770 | $34,814 |
| Interquartile 75% (IQ3) | $43,463 | $46,528 |
| Interquartile Range (IQR) | $12,693 | $11,714 |
| Standard Deviation (Sample) | $7,185 | $10,670 |
| Standard Deviation (Population) | $7,140 | $10,309 |
Similar Demographics by Median Earnings
Demographics Similar to Immigrants from Haiti by Median Earnings
In terms of median earnings, the demographic groups most similar to Immigrants from Haiti are Cuban ($40,619, a difference of 0.17%), Honduran ($40,638, a difference of 0.22%), Yaqui ($40,647, a difference of 0.24%), Chickasaw ($40,672, a difference of 0.30%), and Apache ($40,388, a difference of 0.40%).
| Demographics | Rating | Rank | Median Earnings |
| Shoshone | 0.0 /100 | #302 | Tragic $40,932 |
| Haitians | 0.0 /100 | #303 | Tragic $40,918 |
| Immigrants | Guatemala | 0.0 /100 | #304 | Tragic $40,851 |
| Chickasaw | 0.0 /100 | #305 | Tragic $40,672 |
| Yaqui | 0.0 /100 | #306 | Tragic $40,647 |
| Hondurans | 0.0 /100 | #307 | Tragic $40,638 |
| Cubans | 0.0 /100 | #308 | Tragic $40,619 |
| Immigrants | Haiti | 0.0 /100 | #309 | Tragic $40,550 |
| Apache | 0.0 /100 | #310 | Tragic $40,388 |
| Hispanics or Latinos | 0.0 /100 | #311 | Tragic $40,288 |
| Chippewa | 0.0 /100 | #312 | Tragic $40,287 |
| Choctaw | 0.0 /100 | #313 | Tragic $40,270 |
| Cheyenne | 0.0 /100 | #314 | Tragic $40,233 |
| Seminole | 0.0 /100 | #315 | Tragic $40,233 |
| Immigrants | Honduras | 0.0 /100 | #316 | Tragic $40,195 |
Demographics Similar to Tsimshian by Median Earnings
In terms of median earnings, the demographic groups most similar to Tsimshian are Hawaiian ($43,673, a difference of 0.050%), Alaska Native ($43,750, a difference of 0.13%), Somali ($43,567, a difference of 0.30%), Malaysian ($43,844, a difference of 0.34%), and Liberian ($43,536, a difference of 0.37%).
| Demographics | Rating | Rank | Median Earnings |
| Immigrants | Nonimmigrants | 3.7 /100 | #244 | Tragic $44,117 |
| Immigrants | Burma/Myanmar | 3.2 /100 | #245 | Tragic $43,998 |
| Immigrants | West Indies | 3.1 /100 | #246 | Tragic $43,989 |
| Immigrants | Cabo Verde | 3.0 /100 | #247 | Tragic $43,963 |
| Nepalese | 2.6 /100 | #248 | Tragic $43,860 |
| Malaysians | 2.6 /100 | #249 | Tragic $43,844 |
| Alaska Natives | 2.3 /100 | #250 | Tragic $43,750 |
| Tsimshian | 2.1 /100 | #251 | Tragic $43,695 |
| Hawaiians | 2.0 /100 | #252 | Tragic $43,673 |
| Somalis | 1.8 /100 | #253 | Tragic $43,567 |
| Liberians | 1.7 /100 | #254 | Tragic $43,536 |
| Immigrants | Middle Africa | 1.4 /100 | #255 | Tragic $43,416 |
| Alaskan Athabascans | 1.4 /100 | #256 | Tragic $43,393 |
| Jamaicans | 1.3 /100 | #257 | Tragic $43,343 |
| French American Indians | 1.3 /100 | #258 | Tragic $43,333 |