Immigrants from Cuba vs Bhutanese Median Male Earnings
COMPARE
Immigrants from Cuba
Bhutanese
Median Male Earnings
Median Male Earnings Comparison
Immigrants from Cuba
Bhutanese
$43,461
MEDIAN MALE EARNINGS
0.0/ 100
METRIC RATING
336th/ 347
METRIC RANK
$61,759
MEDIAN MALE EARNINGS
99.9/ 100
METRIC RATING
50th/ 347
METRIC RANK
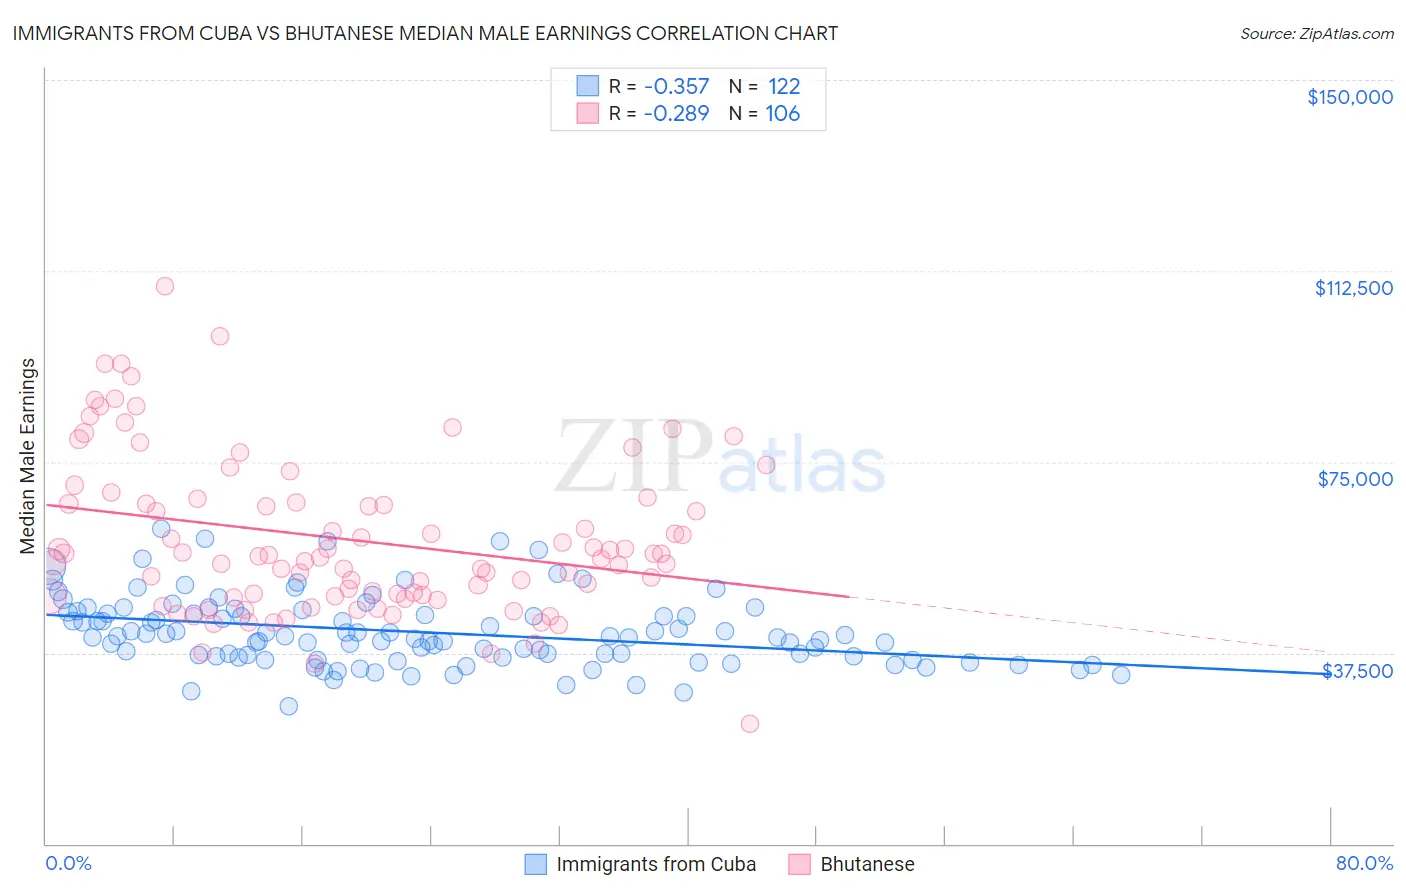
Immigrants from Cuba vs Bhutanese Median Male Earnings Correlation Chart
The statistical analysis conducted on geographies consisting of 325,865,803 people shows a mild negative correlation between the proportion of Immigrants from Cuba and median male earnings in the United States with a correlation coefficient (R) of -0.357 and weighted average of $43,461. Similarly, the statistical analysis conducted on geographies consisting of 455,387,679 people shows a weak negative correlation between the proportion of Bhutanese and median male earnings in the United States with a correlation coefficient (R) of -0.289 and weighted average of $61,759, a difference of 42.1%.
Median Male Earnings Correlation Summary
| Measurement | Immigrants from Cuba | Bhutanese |
| Minimum | $27,045 | $23,594 |
| Maximum | $61,830 | $109,392 |
| Range | $34,785 | $85,798 |
| Mean | $41,590 | $59,697 |
| Median | $40,567 | $56,402 |
| Interquartile 25% (IQ1) | $36,778 | $48,730 |
| Interquartile 75% (IQ3) | $45,280 | $67,058 |
| Interquartile Range (IQR) | $8,502 | $18,327 |
| Standard Deviation (Sample) | $6,813 | $15,498 |
| Standard Deviation (Population) | $6,785 | $15,425 |
Similar Demographics by Median Male Earnings
Demographics Similar to Immigrants from Cuba by Median Male Earnings
In terms of median male earnings, the demographic groups most similar to Immigrants from Cuba are Spanish American Indian ($44,010, a difference of 1.3%), Immigrants from Yemen ($44,083, a difference of 1.4%), Immigrants from Congo ($44,204, a difference of 1.7%), Menominee ($42,581, a difference of 2.1%), and Crow ($42,434, a difference of 2.4%).
| Demographics | Rating | Rank | Median Male Earnings |
| Yakama | 0.0 /100 | #329 | Tragic $45,002 |
| Immigrants | Mexico | 0.0 /100 | #330 | Tragic $44,960 |
| Natives/Alaskans | 0.0 /100 | #331 | Tragic $44,775 |
| Bahamians | 0.0 /100 | #332 | Tragic $44,756 |
| Immigrants | Congo | 0.0 /100 | #333 | Tragic $44,204 |
| Immigrants | Yemen | 0.0 /100 | #334 | Tragic $44,083 |
| Spanish American Indians | 0.0 /100 | #335 | Tragic $44,010 |
| Immigrants | Cuba | 0.0 /100 | #336 | Tragic $43,461 |
| Menominee | 0.0 /100 | #337 | Tragic $42,581 |
| Crow | 0.0 /100 | #338 | Tragic $42,434 |
| Pima | 0.0 /100 | #339 | Tragic $42,357 |
| Navajo | 0.0 /100 | #340 | Tragic $42,098 |
| Hopi | 0.0 /100 | #341 | Tragic $42,060 |
| Arapaho | 0.0 /100 | #342 | Tragic $41,758 |
| Lumbee | 0.0 /100 | #343 | Tragic $41,715 |
Demographics Similar to Bhutanese by Median Male Earnings
In terms of median male earnings, the demographic groups most similar to Bhutanese are Estonian ($61,710, a difference of 0.080%), Immigrants from Norway ($61,628, a difference of 0.21%), Immigrants from Europe ($62,057, a difference of 0.48%), South African ($61,460, a difference of 0.49%), and Immigrants from Latvia ($61,422, a difference of 0.55%).
| Demographics | Rating | Rank | Median Male Earnings |
| Immigrants | Belarus | 100.0 /100 | #43 | Exceptional $62,658 |
| Cambodians | 100.0 /100 | #44 | Exceptional $62,516 |
| Bulgarians | 100.0 /100 | #45 | Exceptional $62,378 |
| Immigrants | Czechoslovakia | 99.9 /100 | #46 | Exceptional $62,217 |
| Immigrants | Austria | 99.9 /100 | #47 | Exceptional $62,164 |
| Immigrants | Malaysia | 99.9 /100 | #48 | Exceptional $62,121 |
| Immigrants | Europe | 99.9 /100 | #49 | Exceptional $62,057 |
| Bhutanese | 99.9 /100 | #50 | Exceptional $61,759 |
| Estonians | 99.9 /100 | #51 | Exceptional $61,710 |
| Immigrants | Norway | 99.9 /100 | #52 | Exceptional $61,628 |
| South Africans | 99.9 /100 | #53 | Exceptional $61,460 |
| Immigrants | Latvia | 99.9 /100 | #54 | Exceptional $61,422 |
| Greeks | 99.9 /100 | #55 | Exceptional $61,242 |
| Lithuanians | 99.9 /100 | #56 | Exceptional $61,228 |
| Immigrants | Scotland | 99.9 /100 | #57 | Exceptional $61,220 |