Immigrants from Cuba vs Immigrants from Caribbean Median Male Earnings
COMPARE
Immigrants from Cuba
Immigrants from Caribbean
Median Male Earnings
Median Male Earnings Comparison
Immigrants from Cuba
Immigrants from Caribbean
$43,461
MEDIAN MALE EARNINGS
0.0/ 100
METRIC RATING
336th/ 347
METRIC RANK
$46,193
MEDIAN MALE EARNINGS
0.0/ 100
METRIC RATING
316th/ 347
METRIC RANK
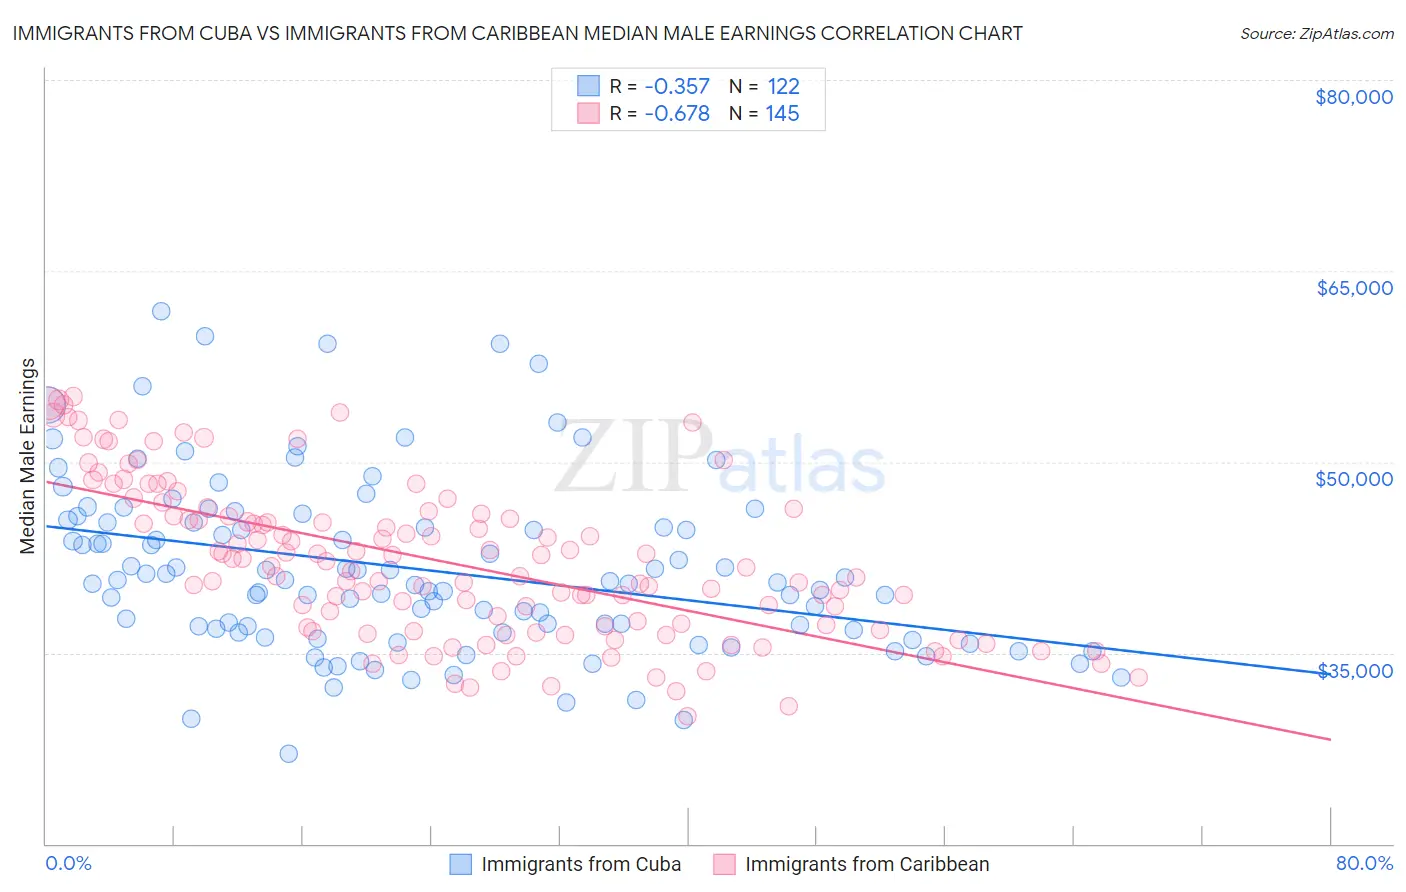
Immigrants from Cuba vs Immigrants from Caribbean Median Male Earnings Correlation Chart
The statistical analysis conducted on geographies consisting of 325,865,803 people shows a mild negative correlation between the proportion of Immigrants from Cuba and median male earnings in the United States with a correlation coefficient (R) of -0.357 and weighted average of $43,461. Similarly, the statistical analysis conducted on geographies consisting of 449,789,932 people shows a significant negative correlation between the proportion of Immigrants from Caribbean and median male earnings in the United States with a correlation coefficient (R) of -0.678 and weighted average of $46,193, a difference of 6.3%.
Median Male Earnings Correlation Summary
| Measurement | Immigrants from Cuba | Immigrants from Caribbean |
| Minimum | $27,045 | $30,010 |
| Maximum | $61,830 | $55,142 |
| Range | $34,785 | $25,132 |
| Mean | $41,590 | $42,215 |
| Median | $40,567 | $41,809 |
| Interquartile 25% (IQ1) | $36,778 | $37,054 |
| Interquartile 75% (IQ3) | $45,280 | $46,037 |
| Interquartile Range (IQR) | $8,502 | $8,984 |
| Standard Deviation (Sample) | $6,813 | $6,100 |
| Standard Deviation (Population) | $6,785 | $6,079 |
Demographics Similar to Immigrants from Cuba and Immigrants from Caribbean by Median Male Earnings
In terms of median male earnings, the demographic groups most similar to Immigrants from Cuba are Spanish American Indian ($44,010, a difference of 1.3%), Immigrants from Yemen ($44,083, a difference of 1.4%), Immigrants from Congo ($44,204, a difference of 1.7%), Bahamian ($44,756, a difference of 3.0%), and Native/Alaskan ($44,775, a difference of 3.0%). Similarly, the demographic groups most similar to Immigrants from Caribbean are Mexican ($46,147, a difference of 0.10%), Cheyenne ($46,062, a difference of 0.28%), Haitian ($45,903, a difference of 0.63%), Immigrants from Honduras ($45,787, a difference of 0.89%), and Fijian ($45,607, a difference of 1.3%).
| Demographics | Rating | Rank | Median Male Earnings |
| Immigrants | Caribbean | 0.0 /100 | #316 | Tragic $46,193 |
| Mexicans | 0.0 /100 | #317 | Tragic $46,147 |
| Cheyenne | 0.0 /100 | #318 | Tragic $46,062 |
| Haitians | 0.0 /100 | #319 | Tragic $45,903 |
| Immigrants | Honduras | 0.0 /100 | #320 | Tragic $45,787 |
| Fijians | 0.0 /100 | #321 | Tragic $45,607 |
| Sioux | 0.0 /100 | #322 | Tragic $45,566 |
| Immigrants | Central America | 0.0 /100 | #323 | Tragic $45,538 |
| Blacks/African Americans | 0.0 /100 | #324 | Tragic $45,523 |
| Yuman | 0.0 /100 | #325 | Tragic $45,446 |
| Immigrants | Haiti | 0.0 /100 | #326 | Tragic $45,266 |
| Immigrants | Bahamas | 0.0 /100 | #327 | Tragic $45,176 |
| Kiowa | 0.0 /100 | #328 | Tragic $45,094 |
| Yakama | 0.0 /100 | #329 | Tragic $45,002 |
| Immigrants | Mexico | 0.0 /100 | #330 | Tragic $44,960 |
| Natives/Alaskans | 0.0 /100 | #331 | Tragic $44,775 |
| Bahamians | 0.0 /100 | #332 | Tragic $44,756 |
| Immigrants | Congo | 0.0 /100 | #333 | Tragic $44,204 |
| Immigrants | Yemen | 0.0 /100 | #334 | Tragic $44,083 |
| Spanish American Indians | 0.0 /100 | #335 | Tragic $44,010 |
| Immigrants | Cuba | 0.0 /100 | #336 | Tragic $43,461 |