Immigrants from Cuba vs Immigrants from Africa Single Mother Households
COMPARE
Immigrants from Cuba
Immigrants from Africa
Single Mother Households
Single Mother Households Comparison
Immigrants from Cuba
Immigrants from Africa
7.5%
SINGLE MOTHER HOUSEHOLDS
0.1/ 100
METRIC RATING
270th/ 347
METRIC RANK
7.3%
SINGLE MOTHER HOUSEHOLDS
0.4/ 100
METRIC RATING
250th/ 347
METRIC RANK
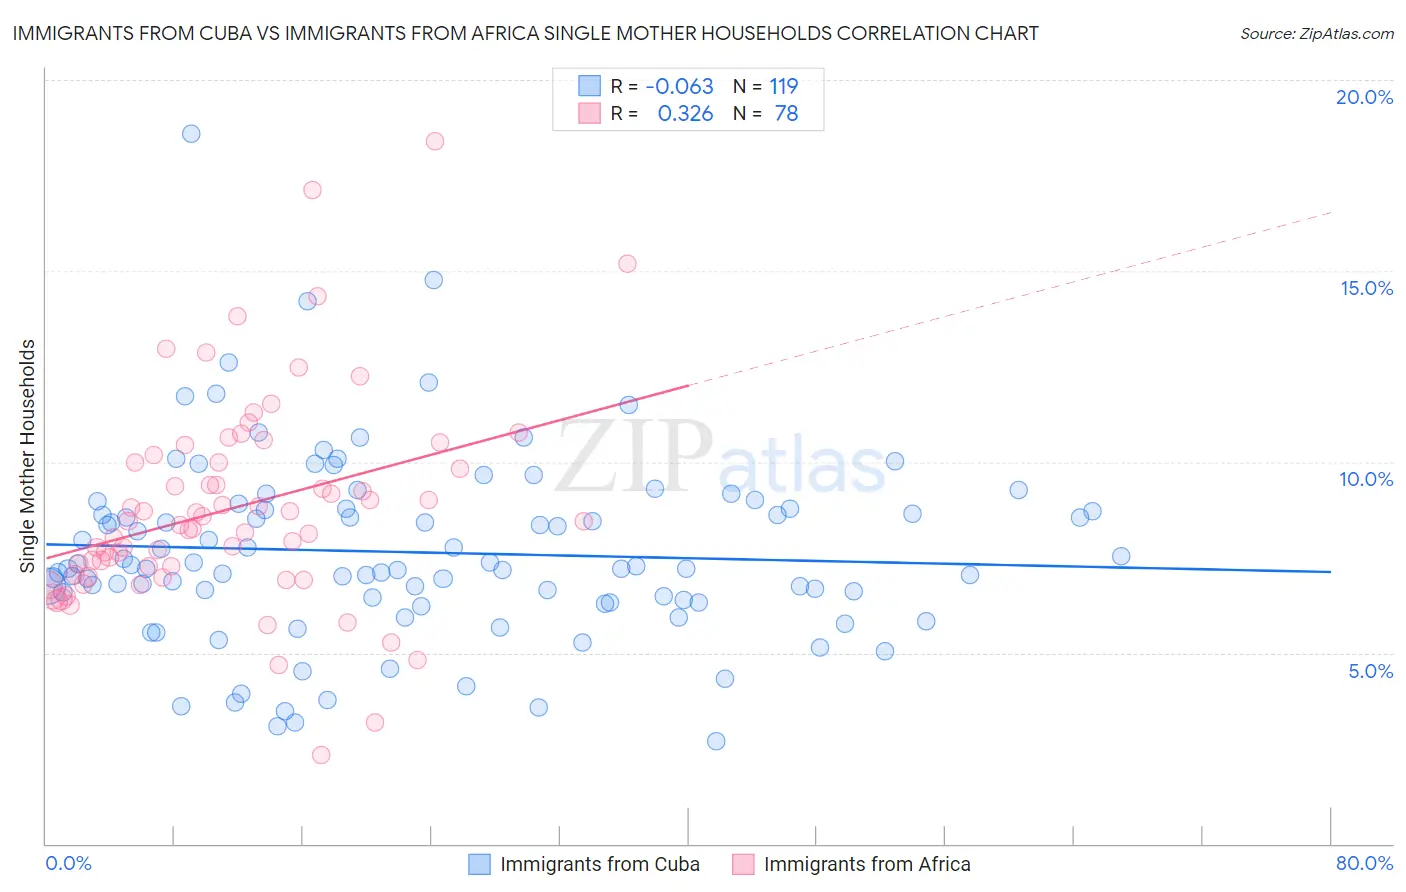
Immigrants from Cuba vs Immigrants from Africa Single Mother Households Correlation Chart
The statistical analysis conducted on geographies consisting of 325,295,846 people shows a slight negative correlation between the proportion of Immigrants from Cuba and percentage of single mother households in the United States with a correlation coefficient (R) of -0.063 and weighted average of 7.5%. Similarly, the statistical analysis conducted on geographies consisting of 467,655,792 people shows a mild positive correlation between the proportion of Immigrants from Africa and percentage of single mother households in the United States with a correlation coefficient (R) of 0.326 and weighted average of 7.3%, a difference of 3.4%.
Single Mother Households Correlation Summary
| Measurement | Immigrants from Cuba | Immigrants from Africa |
| Minimum | 2.7% | 2.3% |
| Maximum | 18.6% | 18.4% |
| Range | 15.9% | 16.1% |
| Mean | 7.6% | 8.8% |
| Median | 7.2% | 8.4% |
| Interquartile 25% (IQ1) | 6.4% | 7.0% |
| Interquartile 75% (IQ3) | 8.8% | 10.0% |
| Interquartile Range (IQR) | 2.4% | 3.0% |
| Standard Deviation (Sample) | 2.4% | 2.7% |
| Standard Deviation (Population) | 2.4% | 2.7% |
Demographics Similar to Immigrants from Cuba and Immigrants from Africa by Single Mother Households
In terms of single mother households, the demographic groups most similar to Immigrants from Cuba are Somali (7.5%, a difference of 0.16%), Indonesian (7.5%, a difference of 0.58%), Blackfeet (7.5%, a difference of 0.62%), Nepalese (7.5%, a difference of 0.96%), and Crow (7.4%, a difference of 1.1%). Similarly, the demographic groups most similar to Immigrants from Africa are Malaysian (7.3%, a difference of 0.34%), Alaskan Athabascan (7.3%, a difference of 0.37%), Cajun (7.3%, a difference of 0.75%), Immigrants from Ecuador (7.3%, a difference of 0.80%), and Mexican American Indian (7.4%, a difference of 1.2%).
| Demographics | Rating | Rank | Single Mother Households |
| Immigrants | Africa | 0.4 /100 | #250 | Tragic 7.3% |
| Malaysians | 0.3 /100 | #251 | Tragic 7.3% |
| Alaskan Athabascans | 0.3 /100 | #252 | Tragic 7.3% |
| Cajuns | 0.3 /100 | #253 | Tragic 7.3% |
| Immigrants | Ecuador | 0.3 /100 | #254 | Tragic 7.3% |
| Mexican American Indians | 0.2 /100 | #255 | Tragic 7.4% |
| Seminole | 0.2 /100 | #256 | Tragic 7.4% |
| Alaska Natives | 0.2 /100 | #257 | Tragic 7.4% |
| Pueblo | 0.2 /100 | #258 | Tragic 7.4% |
| Immigrants | Yemen | 0.2 /100 | #259 | Tragic 7.4% |
| Immigrants | Zaire | 0.2 /100 | #260 | Tragic 7.4% |
| Japanese | 0.2 /100 | #261 | Tragic 7.4% |
| Immigrants | Somalia | 0.2 /100 | #262 | Tragic 7.4% |
| Immigrants | Nicaragua | 0.2 /100 | #263 | Tragic 7.4% |
| Yaqui | 0.1 /100 | #264 | Tragic 7.4% |
| Crow | 0.1 /100 | #265 | Tragic 7.4% |
| Nepalese | 0.1 /100 | #266 | Tragic 7.5% |
| Blackfeet | 0.1 /100 | #267 | Tragic 7.5% |
| Indonesians | 0.1 /100 | #268 | Tragic 7.5% |
| Somalis | 0.1 /100 | #269 | Tragic 7.5% |
| Immigrants | Cuba | 0.1 /100 | #270 | Tragic 7.5% |