Immigrants from Cuba vs Bahamian Median Male Earnings
COMPARE
Immigrants from Cuba
Bahamian
Median Male Earnings
Median Male Earnings Comparison
Immigrants from Cuba
Bahamians
$43,461
MEDIAN MALE EARNINGS
0.0/ 100
METRIC RATING
336th/ 347
METRIC RANK
$44,756
MEDIAN MALE EARNINGS
0.0/ 100
METRIC RATING
332nd/ 347
METRIC RANK
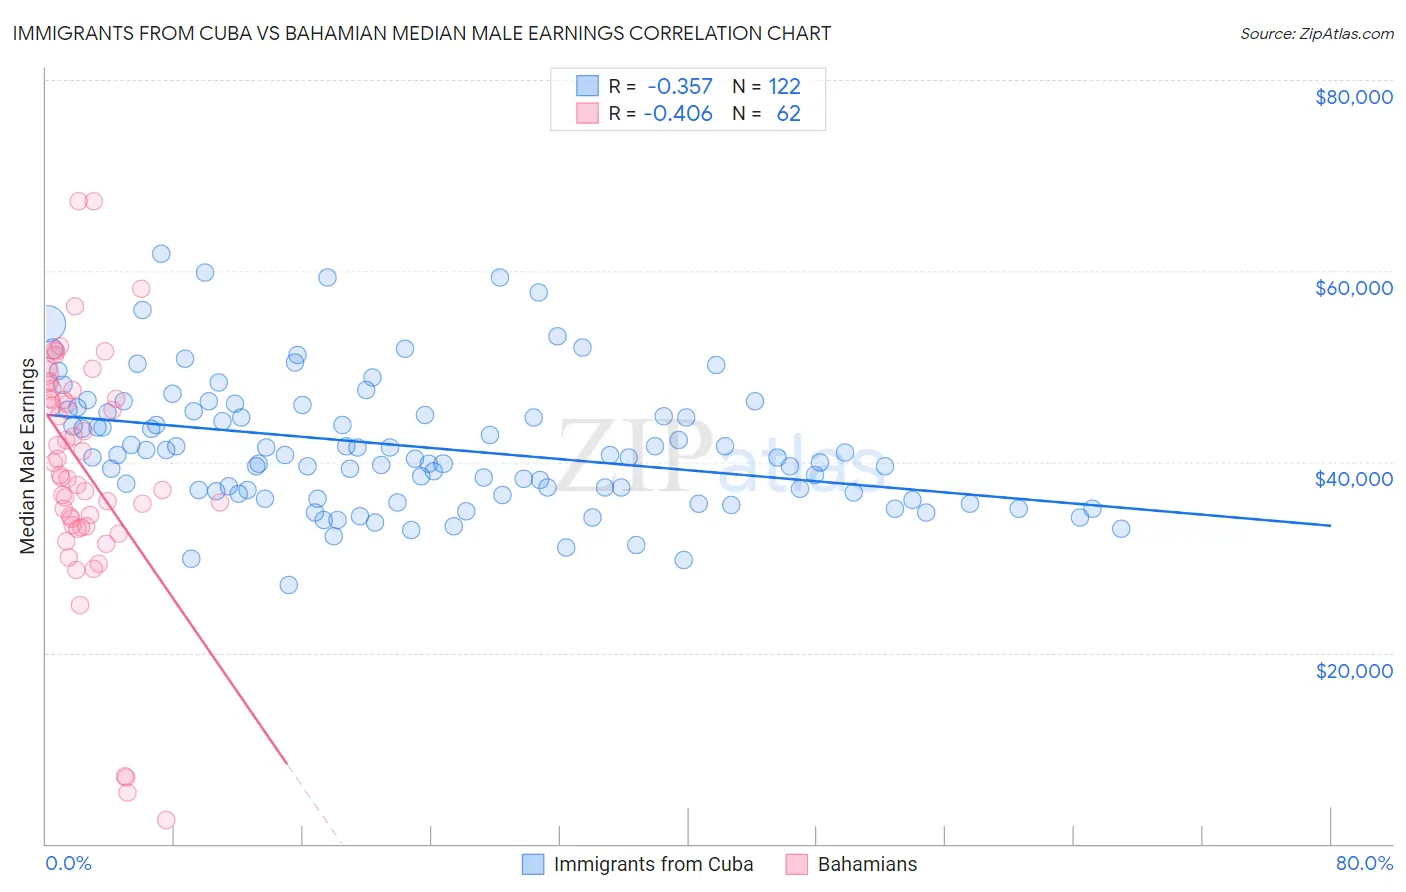
Immigrants from Cuba vs Bahamian Median Male Earnings Correlation Chart
The statistical analysis conducted on geographies consisting of 325,865,803 people shows a mild negative correlation between the proportion of Immigrants from Cuba and median male earnings in the United States with a correlation coefficient (R) of -0.357 and weighted average of $43,461. Similarly, the statistical analysis conducted on geographies consisting of 112,679,918 people shows a moderate negative correlation between the proportion of Bahamians and median male earnings in the United States with a correlation coefficient (R) of -0.406 and weighted average of $44,756, a difference of 3.0%.
Median Male Earnings Correlation Summary
| Measurement | Immigrants from Cuba | Bahamian |
| Minimum | $27,045 | $2,499 |
| Maximum | $61,830 | $67,317 |
| Range | $34,785 | $64,818 |
| Mean | $41,590 | $39,425 |
| Median | $40,567 | $39,316 |
| Interquartile 25% (IQ1) | $36,778 | $33,442 |
| Interquartile 75% (IQ3) | $45,280 | $47,537 |
| Interquartile Range (IQR) | $8,502 | $14,095 |
| Standard Deviation (Sample) | $6,813 | $12,607 |
| Standard Deviation (Population) | $6,785 | $12,505 |
Demographics Similar to Immigrants from Cuba and Bahamians by Median Male Earnings
In terms of median male earnings, the demographic groups most similar to Immigrants from Cuba are Spanish American Indian ($44,010, a difference of 1.3%), Immigrants from Yemen ($44,083, a difference of 1.4%), Immigrants from Congo ($44,204, a difference of 1.7%), Menominee ($42,581, a difference of 2.1%), and Crow ($42,434, a difference of 2.4%). Similarly, the demographic groups most similar to Bahamians are Native/Alaskan ($44,775, a difference of 0.040%), Immigrants from Mexico ($44,960, a difference of 0.46%), Yakama ($45,002, a difference of 0.55%), Kiowa ($45,094, a difference of 0.76%), and Immigrants from Bahamas ($45,176, a difference of 0.94%).
| Demographics | Rating | Rank | Median Male Earnings |
| Blacks/African Americans | 0.0 /100 | #324 | Tragic $45,523 |
| Yuman | 0.0 /100 | #325 | Tragic $45,446 |
| Immigrants | Haiti | 0.0 /100 | #326 | Tragic $45,266 |
| Immigrants | Bahamas | 0.0 /100 | #327 | Tragic $45,176 |
| Kiowa | 0.0 /100 | #328 | Tragic $45,094 |
| Yakama | 0.0 /100 | #329 | Tragic $45,002 |
| Immigrants | Mexico | 0.0 /100 | #330 | Tragic $44,960 |
| Natives/Alaskans | 0.0 /100 | #331 | Tragic $44,775 |
| Bahamians | 0.0 /100 | #332 | Tragic $44,756 |
| Immigrants | Congo | 0.0 /100 | #333 | Tragic $44,204 |
| Immigrants | Yemen | 0.0 /100 | #334 | Tragic $44,083 |
| Spanish American Indians | 0.0 /100 | #335 | Tragic $44,010 |
| Immigrants | Cuba | 0.0 /100 | #336 | Tragic $43,461 |
| Menominee | 0.0 /100 | #337 | Tragic $42,581 |
| Crow | 0.0 /100 | #338 | Tragic $42,434 |
| Pima | 0.0 /100 | #339 | Tragic $42,357 |
| Navajo | 0.0 /100 | #340 | Tragic $42,098 |
| Hopi | 0.0 /100 | #341 | Tragic $42,060 |
| Arapaho | 0.0 /100 | #342 | Tragic $41,758 |
| Lumbee | 0.0 /100 | #343 | Tragic $41,715 |
| Pueblo | 0.0 /100 | #344 | Tragic $41,314 |