Immigrants from Congo vs German Russian Median Earnings
COMPARE
Immigrants from Congo
German Russian
Median Earnings
Median Earnings Comparison
Immigrants from Congo
German Russians
$39,169
MEDIAN EARNINGS
0.0/ 100
METRIC RATING
330th/ 347
METRIC RANK
$43,200
MEDIAN EARNINGS
1.1/ 100
METRIC RATING
259th/ 347
METRIC RANK
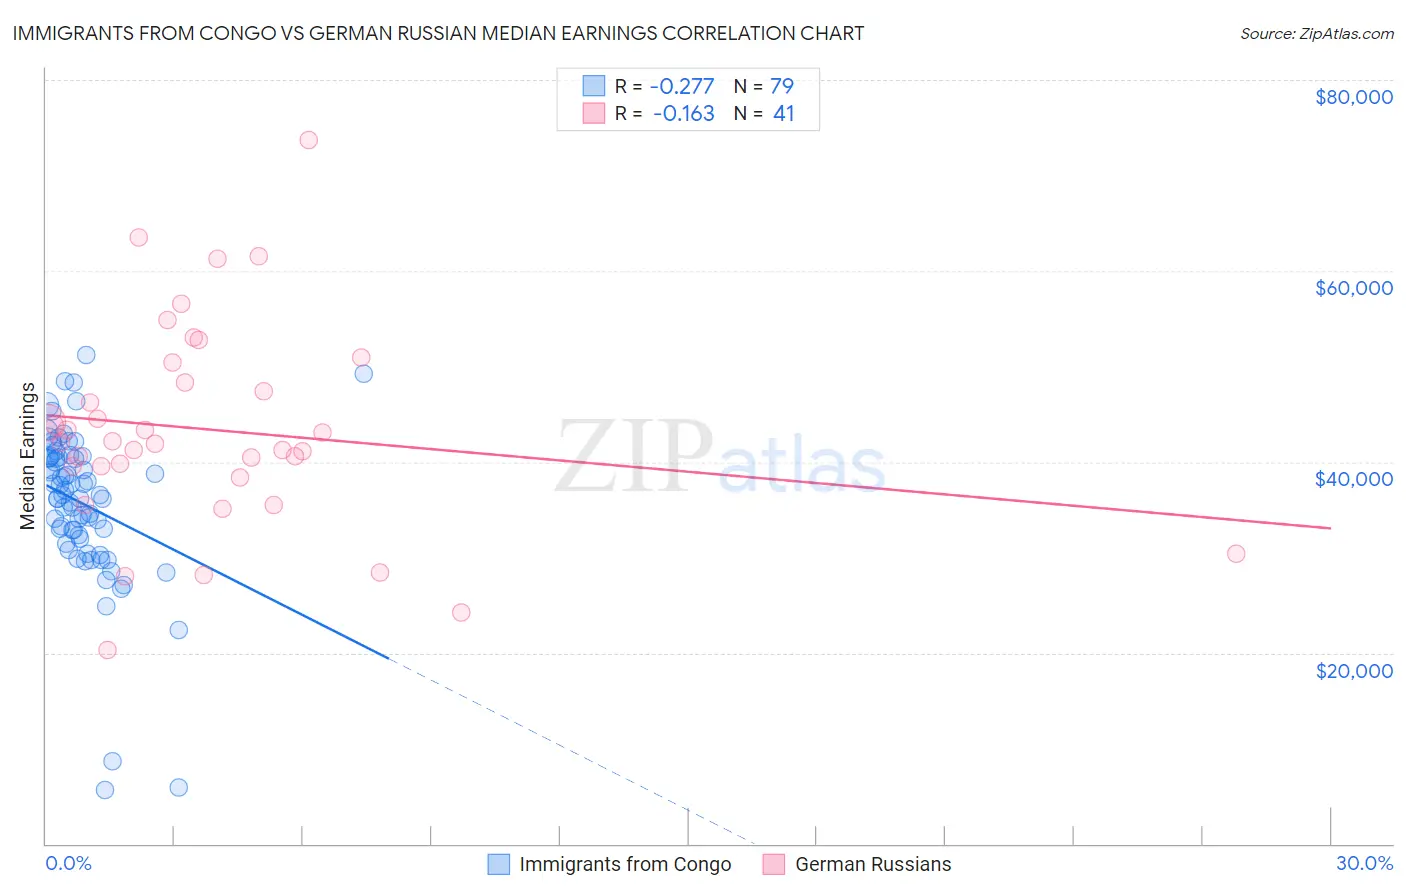
Immigrants from Congo vs German Russian Median Earnings Correlation Chart
The statistical analysis conducted on geographies consisting of 92,120,169 people shows a weak negative correlation between the proportion of Immigrants from Congo and median earnings in the United States with a correlation coefficient (R) of -0.277 and weighted average of $39,169. Similarly, the statistical analysis conducted on geographies consisting of 96,461,266 people shows a poor negative correlation between the proportion of German Russians and median earnings in the United States with a correlation coefficient (R) of -0.163 and weighted average of $43,200, a difference of 10.3%.
Median Earnings Correlation Summary
| Measurement | Immigrants from Congo | German Russian |
| Minimum | $5,625 | $20,324 |
| Maximum | $51,158 | $73,750 |
| Range | $45,533 | $53,426 |
| Mean | $35,599 | $43,344 |
| Median | $36,543 | $42,036 |
| Interquartile 25% (IQ1) | $31,963 | $38,952 |
| Interquartile 75% (IQ3) | $40,520 | $49,348 |
| Interquartile Range (IQR) | $8,557 | $10,396 |
| Standard Deviation (Sample) | $8,202 | $10,822 |
| Standard Deviation (Population) | $8,150 | $10,689 |
Similar Demographics by Median Earnings
Demographics Similar to Immigrants from Congo by Median Earnings
In terms of median earnings, the demographic groups most similar to Immigrants from Congo are Immigrants from Mexico ($39,114, a difference of 0.14%), Kiowa ($39,232, a difference of 0.16%), Yakama ($39,107, a difference of 0.16%), Houma ($38,949, a difference of 0.57%), and Spanish American Indian ($38,907, a difference of 0.67%).
| Demographics | Rating | Rank | Median Earnings |
| Bahamians | 0.0 /100 | #323 | Tragic $39,735 |
| Ottawa | 0.0 /100 | #324 | Tragic $39,721 |
| Creek | 0.0 /100 | #325 | Tragic $39,648 |
| Immigrants | Yemen | 0.0 /100 | #326 | Tragic $39,540 |
| Yuman | 0.0 /100 | #327 | Tragic $39,523 |
| Sioux | 0.0 /100 | #328 | Tragic $39,448 |
| Kiowa | 0.0 /100 | #329 | Tragic $39,232 |
| Immigrants | Congo | 0.0 /100 | #330 | Tragic $39,169 |
| Immigrants | Mexico | 0.0 /100 | #331 | Tragic $39,114 |
| Yakama | 0.0 /100 | #332 | Tragic $39,107 |
| Houma | 0.0 /100 | #333 | Tragic $38,949 |
| Spanish American Indians | 0.0 /100 | #334 | Tragic $38,907 |
| Natives/Alaskans | 0.0 /100 | #335 | Tragic $38,896 |
| Crow | 0.0 /100 | #336 | Tragic $38,707 |
| Immigrants | Cuba | 0.0 /100 | #337 | Tragic $38,426 |
Demographics Similar to German Russians by Median Earnings
In terms of median earnings, the demographic groups most similar to German Russians are Immigrants from Somalia ($43,100, a difference of 0.23%), French American Indian ($43,333, a difference of 0.31%), Jamaican ($43,343, a difference of 0.33%), Immigrants from Jamaica ($43,026, a difference of 0.40%), and Nicaraguan ($43,026, a difference of 0.40%).
| Demographics | Rating | Rank | Median Earnings |
| Hawaiians | 2.0 /100 | #252 | Tragic $43,673 |
| Somalis | 1.8 /100 | #253 | Tragic $43,567 |
| Liberians | 1.7 /100 | #254 | Tragic $43,536 |
| Immigrants | Middle Africa | 1.4 /100 | #255 | Tragic $43,416 |
| Alaskan Athabascans | 1.4 /100 | #256 | Tragic $43,393 |
| Jamaicans | 1.3 /100 | #257 | Tragic $43,343 |
| French American Indians | 1.3 /100 | #258 | Tragic $43,333 |
| German Russians | 1.1 /100 | #259 | Tragic $43,200 |
| Immigrants | Somalia | 0.9 /100 | #260 | Tragic $43,100 |
| Immigrants | Jamaica | 0.8 /100 | #261 | Tragic $43,026 |
| Nicaraguans | 0.8 /100 | #262 | Tragic $43,026 |
| Inupiat | 0.8 /100 | #263 | Tragic $43,000 |
| Immigrants | Liberia | 0.7 /100 | #264 | Tragic $42,923 |
| Salvadorans | 0.7 /100 | #265 | Tragic $42,912 |
| Immigrants | Laos | 0.7 /100 | #266 | Tragic $42,884 |