Immigrants from Congo vs Yakama Median Earnings
COMPARE
Immigrants from Congo
Yakama
Median Earnings
Median Earnings Comparison
Immigrants from Congo
Yakama
$39,169
MEDIAN EARNINGS
0.0/ 100
METRIC RATING
330th/ 347
METRIC RANK
$39,107
MEDIAN EARNINGS
0.0/ 100
METRIC RATING
332nd/ 347
METRIC RANK
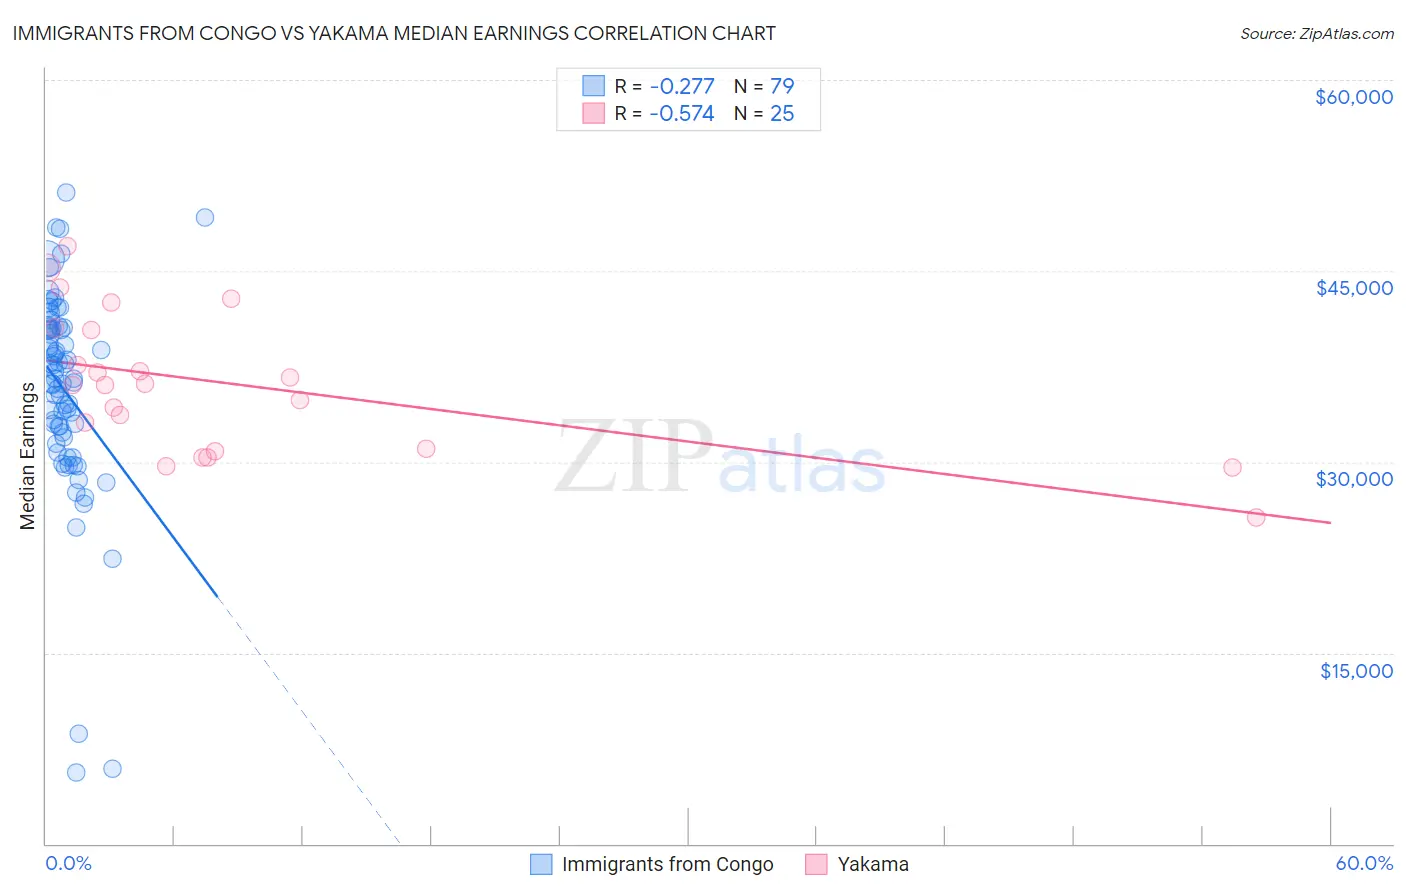
Immigrants from Congo vs Yakama Median Earnings Correlation Chart
The statistical analysis conducted on geographies consisting of 92,120,169 people shows a weak negative correlation between the proportion of Immigrants from Congo and median earnings in the United States with a correlation coefficient (R) of -0.277 and weighted average of $39,169. Similarly, the statistical analysis conducted on geographies consisting of 19,920,783 people shows a substantial negative correlation between the proportion of Yakama and median earnings in the United States with a correlation coefficient (R) of -0.574 and weighted average of $39,107, a difference of 0.16%.
Median Earnings Correlation Summary
| Measurement | Immigrants from Congo | Yakama |
| Minimum | $5,625 | $25,625 |
| Maximum | $51,158 | $46,951 |
| Range | $45,533 | $21,326 |
| Mean | $35,599 | $36,082 |
| Median | $36,543 | $36,058 |
| Interquartile 25% (IQ1) | $31,963 | $30,946 |
| Interquartile 75% (IQ3) | $40,520 | $40,418 |
| Interquartile Range (IQR) | $8,557 | $9,471 |
| Standard Deviation (Sample) | $8,202 | $5,481 |
| Standard Deviation (Population) | $8,150 | $5,370 |
Demographics Similar to Immigrants from Congo and Yakama by Median Earnings
In terms of median earnings, the demographic groups most similar to Immigrants from Congo are Immigrants from Mexico ($39,114, a difference of 0.14%), Kiowa ($39,232, a difference of 0.16%), Houma ($38,949, a difference of 0.57%), Spanish American Indian ($38,907, a difference of 0.67%), and Native/Alaskan ($38,896, a difference of 0.70%). Similarly, the demographic groups most similar to Yakama are Immigrants from Mexico ($39,114, a difference of 0.020%), Kiowa ($39,232, a difference of 0.32%), Houma ($38,949, a difference of 0.41%), Spanish American Indian ($38,907, a difference of 0.52%), and Native/Alaskan ($38,896, a difference of 0.54%).
| Demographics | Rating | Rank | Median Earnings |
| Mexicans | 0.0 /100 | #321 | Tragic $39,834 |
| Immigrants | Central America | 0.0 /100 | #322 | Tragic $39,762 |
| Bahamians | 0.0 /100 | #323 | Tragic $39,735 |
| Ottawa | 0.0 /100 | #324 | Tragic $39,721 |
| Creek | 0.0 /100 | #325 | Tragic $39,648 |
| Immigrants | Yemen | 0.0 /100 | #326 | Tragic $39,540 |
| Yuman | 0.0 /100 | #327 | Tragic $39,523 |
| Sioux | 0.0 /100 | #328 | Tragic $39,448 |
| Kiowa | 0.0 /100 | #329 | Tragic $39,232 |
| Immigrants | Congo | 0.0 /100 | #330 | Tragic $39,169 |
| Immigrants | Mexico | 0.0 /100 | #331 | Tragic $39,114 |
| Yakama | 0.0 /100 | #332 | Tragic $39,107 |
| Houma | 0.0 /100 | #333 | Tragic $38,949 |
| Spanish American Indians | 0.0 /100 | #334 | Tragic $38,907 |
| Natives/Alaskans | 0.0 /100 | #335 | Tragic $38,896 |
| Crow | 0.0 /100 | #336 | Tragic $38,707 |
| Immigrants | Cuba | 0.0 /100 | #337 | Tragic $38,426 |
| Pima | 0.0 /100 | #338 | Tragic $38,285 |
| Menominee | 0.0 /100 | #339 | Tragic $37,884 |
| Navajo | 0.0 /100 | #340 | Tragic $36,999 |
| Lumbee | 0.0 /100 | #341 | Tragic $36,876 |