Immigrants from Congo vs Immigrants from Israel Median Earnings
COMPARE
Immigrants from Congo
Immigrants from Israel
Median Earnings
Median Earnings Comparison
Immigrants from Congo
Immigrants from Israel
$39,169
MEDIAN EARNINGS
0.0/ 100
METRIC RATING
330th/ 347
METRIC RANK
$57,034
MEDIAN EARNINGS
100.0/ 100
METRIC RATING
11th/ 347
METRIC RANK
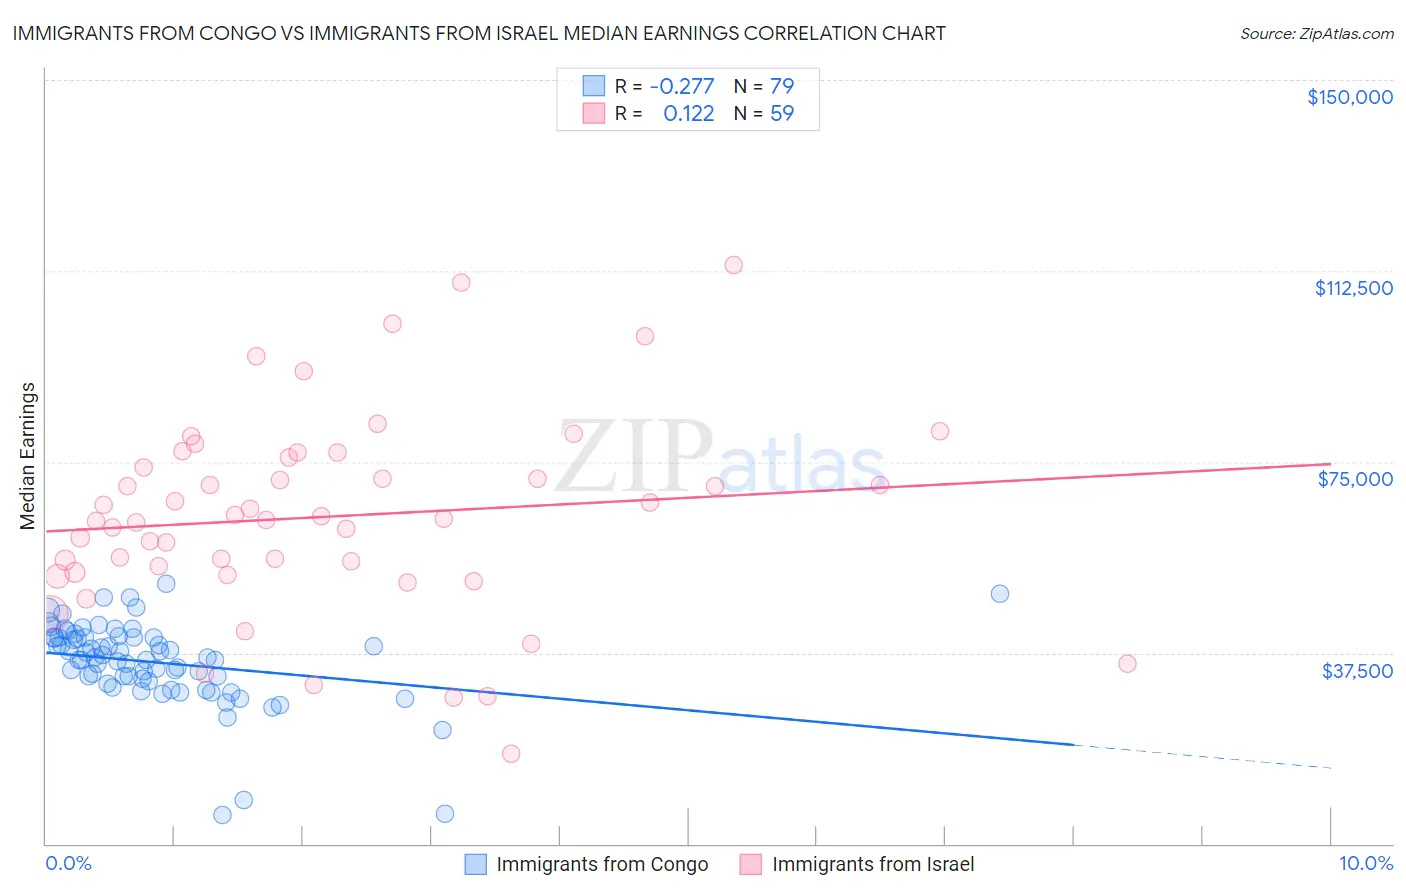
Immigrants from Congo vs Immigrants from Israel Median Earnings Correlation Chart
The statistical analysis conducted on geographies consisting of 92,120,169 people shows a weak negative correlation between the proportion of Immigrants from Congo and median earnings in the United States with a correlation coefficient (R) of -0.277 and weighted average of $39,169. Similarly, the statistical analysis conducted on geographies consisting of 210,025,881 people shows a poor positive correlation between the proportion of Immigrants from Israel and median earnings in the United States with a correlation coefficient (R) of 0.122 and weighted average of $57,034, a difference of 45.6%.
Median Earnings Correlation Summary
| Measurement | Immigrants from Congo | Immigrants from Israel |
| Minimum | $5,625 | $17,782 |
| Maximum | $51,158 | $113,636 |
| Range | $45,533 | $95,854 |
| Mean | $35,599 | $64,255 |
| Median | $36,543 | $63,844 |
| Interquartile 25% (IQ1) | $31,963 | $53,296 |
| Interquartile 75% (IQ3) | $40,520 | $75,870 |
| Interquartile Range (IQR) | $8,557 | $22,574 |
| Standard Deviation (Sample) | $8,202 | $19,481 |
| Standard Deviation (Population) | $8,150 | $19,315 |
Similar Demographics by Median Earnings
Demographics Similar to Immigrants from Congo by Median Earnings
In terms of median earnings, the demographic groups most similar to Immigrants from Congo are Immigrants from Mexico ($39,114, a difference of 0.14%), Kiowa ($39,232, a difference of 0.16%), Yakama ($39,107, a difference of 0.16%), Houma ($38,949, a difference of 0.57%), and Spanish American Indian ($38,907, a difference of 0.67%).
| Demographics | Rating | Rank | Median Earnings |
| Bahamians | 0.0 /100 | #323 | Tragic $39,735 |
| Ottawa | 0.0 /100 | #324 | Tragic $39,721 |
| Creek | 0.0 /100 | #325 | Tragic $39,648 |
| Immigrants | Yemen | 0.0 /100 | #326 | Tragic $39,540 |
| Yuman | 0.0 /100 | #327 | Tragic $39,523 |
| Sioux | 0.0 /100 | #328 | Tragic $39,448 |
| Kiowa | 0.0 /100 | #329 | Tragic $39,232 |
| Immigrants | Congo | 0.0 /100 | #330 | Tragic $39,169 |
| Immigrants | Mexico | 0.0 /100 | #331 | Tragic $39,114 |
| Yakama | 0.0 /100 | #332 | Tragic $39,107 |
| Houma | 0.0 /100 | #333 | Tragic $38,949 |
| Spanish American Indians | 0.0 /100 | #334 | Tragic $38,907 |
| Natives/Alaskans | 0.0 /100 | #335 | Tragic $38,896 |
| Crow | 0.0 /100 | #336 | Tragic $38,707 |
| Immigrants | Cuba | 0.0 /100 | #337 | Tragic $38,426 |
Demographics Similar to Immigrants from Israel by Median Earnings
In terms of median earnings, the demographic groups most similar to Immigrants from Israel are Immigrants from South Central Asia ($57,114, a difference of 0.14%), Immigrants from Ireland ($56,854, a difference of 0.32%), Immigrants from China ($56,638, a difference of 0.70%), Okinawan ($57,550, a difference of 0.90%), and Immigrants from Iran ($57,612, a difference of 1.0%).
| Demographics | Rating | Rank | Median Earnings |
| Immigrants | Hong Kong | 100.0 /100 | #4 | Exceptional $59,433 |
| Thais | 100.0 /100 | #5 | Exceptional $59,237 |
| Immigrants | Singapore | 100.0 /100 | #6 | Exceptional $59,038 |
| Iranians | 100.0 /100 | #7 | Exceptional $58,474 |
| Immigrants | Iran | 100.0 /100 | #8 | Exceptional $57,612 |
| Okinawans | 100.0 /100 | #9 | Exceptional $57,550 |
| Immigrants | South Central Asia | 100.0 /100 | #10 | Exceptional $57,114 |
| Immigrants | Israel | 100.0 /100 | #11 | Exceptional $57,034 |
| Immigrants | Ireland | 100.0 /100 | #12 | Exceptional $56,854 |
| Immigrants | China | 100.0 /100 | #13 | Exceptional $56,638 |
| Immigrants | Australia | 100.0 /100 | #14 | Exceptional $56,305 |
| Indians (Asian) | 100.0 /100 | #15 | Exceptional $56,253 |
| Immigrants | Eastern Asia | 100.0 /100 | #16 | Exceptional $56,183 |
| Eastern Europeans | 100.0 /100 | #17 | Exceptional $55,084 |
| Immigrants | Japan | 100.0 /100 | #18 | Exceptional $54,938 |