Immigrants from Congo vs Immigrants from Bahamas Disability Age 65 to 74

COMPARE

Immigrants from Congo
Race
Ancestry
AfghanAfricanAlaska NativeAlaskan AthabascanAlbanianAleutAlsatianAmericanApacheArabArapahoArgentineanArmenianAssyrian/Chaldean/SyriacAustralianAustrianBahamianBangladeshiBarbadianBasqueBelgianBelizeanBermudanBhutaneseBlackfeetBolivianBrazilianBritishBritish West IndianBulgarianBurmeseCajunCambodianCanadianCape VerdeanCarpatho RusynCelticCentral AmericanCentral American IndianCherokeeCheyenneChickasawChileanChineseChippewaChoctawColombianColvilleComancheCosta RicanCreeCreekCroatianCrowCubanCypriotCzechCzechoslovakianDanishDelawareDominicanDutchDutch West IndianEastern EuropeanEcuadorianEgyptianEnglishEstonianEthiopianEuropeanFijianFilipinoFinnishFrenchFrench American IndianFrench CanadianGermanGerman RussianGhanaianGreekGuamanian/ChamorroGuatemalanGuyaneseHaitianHmongHonduranHopiHoumaHungarianIcelanderIndian (Asian)IndonesianInupiatIranianIraqiIrishIroquoisIsraeliItalianJamaicanJapaneseJordanianKenyanKiowaKoreanLaotianLatvianLebaneseLiberianLithuanianLumbeeLuxembourgerMacedonianMalaysianMalteseMarshalleseMenomineeMexicanMexican American IndianMongolianMoroccanNative HawaiianNavajoNepaleseNew ZealanderNicaraguanNigerianNorthern EuropeanNorwegianOkinawanOsageOttawaPaiutePakistaniPalestinianPanamanianParaguayanPennsylvania GermanPeruvianPimaPolishPortuguesePotawatomiPuebloPuerto RicanPuget Sound SalishRomanianRussianSalvadoranSamoanScandinavianScotch-IrishScottishSeminoleSenegaleseSerbianShoshoneSierra LeoneanSiouxSlavicSlovakSloveneSomaliSouth AfricanSouth AmericanSouth American IndianSoviet UnionSpaniardSpanishSpanish AmericanSpanish American IndianSri LankanSubsaharan AfricanSudaneseSwedishSwissSyrianTaiwaneseThaiTlingit-HaidaTohono O'OdhamTonganTrinidadian and TobagonianTsimshianTurkishU.S. Virgin IslanderUgandanUkrainianUruguayanUteVenezuelanVietnameseWelshWest IndianYakamaYaquiYugoslavianYumanYup'ikZimbabwean
Immigration
NonimmigrantsImmigrantsAfghanistanAfricaAlbaniaArgentinaArmeniaAsiaAustraliaAustriaBangladeshBarbadosBelarusBelgiumBelizeBoliviaBosnia and HerzegovinaBrazilBulgariaBurma/MyanmarCabo VerdeCambodiaCameroonCanadaCaribbeanCentral AmericaChileChinaColombiaCongoCosta RicaCroatiaCubaCzechoslovakiaDenmarkDominicaDominican RepublicEastern AfricaEastern AsiaEastern EuropeEcuadorEgyptEl SalvadorEnglandEritreaEthiopiaEuropeFijiFranceGermanyGhanaGreeceGrenadaGuatemalaGuyanaHaitiHondurasHong KongHungaryIndiaIndonesiaIranIraqIrelandIsraelItalyJamaicaJapanJordanKazakhstanKenyaKoreaKuwaitLaosLatin AmericaLatviaLebanonLiberiaLithuaniaMalaysiaMexicoMicronesiaMiddle AfricaMoldovaMoroccoNepalNetherlandsNicaraguaNigeriaNorth AmericaNorth MacedoniaNorthern AfricaNorthern EuropeNorwayOceaniaPakistanPanamaPeruPhilippinesPolandPortugalRomaniaRussiaSaudi ArabiaScotlandSenegalSerbiaSierra LeoneSingaporeSomaliaSouth AfricaSouth AmericaSouth Central AsiaSouth Eastern AsiaSouthern EuropeSpainSri LankaSt. Vincent and the GrenadinesSudanSwedenSwitzerlandSyriaTaiwanThailandTrinidad and TobagoTurkeyUgandaUkraineUruguayUzbekistanVenezuelaVietnamWest IndiesWestern AfricaWestern AsiaWestern EuropeYemenZaireZimbabweAzores
Immigrants from Bahamas
Race
Ancestry
AfghanAfricanAlaska NativeAlaskan AthabascanAlbanianAleutAlsatianAmericanApacheArabArapahoArgentineanArmenianAssyrian/Chaldean/SyriacAustralianAustrianBahamianBangladeshiBarbadianBasqueBelgianBelizeanBermudanBhutaneseBlackfeetBolivianBrazilianBritishBritish West IndianBulgarianBurmeseCajunCambodianCanadianCape VerdeanCarpatho RusynCelticCentral AmericanCentral American IndianCherokeeCheyenneChickasawChileanChineseChippewaChoctawColombianColvilleComancheCosta RicanCreeCreekCroatianCrowCubanCypriotCzechCzechoslovakianDanishDelawareDominicanDutchDutch West IndianEastern EuropeanEcuadorianEgyptianEnglishEstonianEthiopianEuropeanFijianFilipinoFinnishFrenchFrench American IndianFrench CanadianGermanGerman RussianGhanaianGreekGuamanian/ChamorroGuatemalanGuyaneseHaitianHmongHonduranHopiHoumaHungarianIcelanderIndian (Asian)IndonesianInupiatIranianIraqiIrishIroquoisIsraeliItalianJamaicanJapaneseJordanianKenyanKiowaKoreanLaotianLatvianLebaneseLiberianLithuanianLumbeeLuxembourgerMacedonianMalaysianMalteseMarshalleseMenomineeMexicanMexican American IndianMongolianMoroccanNative HawaiianNavajoNepaleseNew ZealanderNicaraguanNigerianNorthern EuropeanNorwegianOkinawanOsageOttawaPaiutePakistaniPalestinianPanamanianParaguayanPennsylvania GermanPeruvianPimaPolishPortuguesePotawatomiPuebloPuerto RicanPuget Sound SalishRomanianRussianSalvadoranSamoanScandinavianScotch-IrishScottishSeminoleSenegaleseSerbianShoshoneSierra LeoneanSiouxSlavicSlovakSloveneSomaliSouth AfricanSouth AmericanSouth American IndianSoviet UnionSpaniardSpanishSpanish AmericanSpanish American IndianSri LankanSubsaharan AfricanSudaneseSwedishSwissSyrianTaiwaneseThaiTlingit-HaidaTohono O'OdhamTonganTrinidadian and TobagonianTsimshianTurkishU.S. Virgin IslanderUgandanUkrainianUruguayanUteVenezuelanVietnameseWelshWest IndianYakamaYaquiYugoslavianYumanYup'ikZimbabwean
Immigration
NonimmigrantsImmigrantsAfghanistanAfricaAlbaniaArgentinaArmeniaAsiaAustraliaAustriaBahamasBangladeshBarbadosBelarusBelgiumBelizeBoliviaBosnia and HerzegovinaBrazilBulgariaBurma/MyanmarCabo VerdeCambodiaCameroonCanadaCaribbeanCentral AmericaChileChinaColombiaCosta RicaCroatiaCubaCzechoslovakiaDenmarkDominicaDominican RepublicEastern AfricaEastern AsiaEastern EuropeEcuadorEgyptEl SalvadorEnglandEritreaEthiopiaEuropeFijiFranceGermanyGhanaGreeceGrenadaGuatemalaGuyanaHaitiHondurasHong KongHungaryIndiaIndonesiaIranIraqIrelandIsraelItalyJamaicaJapanJordanKazakhstanKenyaKoreaKuwaitLaosLatin AmericaLatviaLebanonLiberiaLithuaniaMalaysiaMexicoMicronesiaMiddle AfricaMoldovaMoroccoNepalNetherlandsNicaraguaNigeriaNorth AmericaNorth MacedoniaNorthern AfricaNorthern EuropeNorwayOceaniaPakistanPanamaPeruPhilippinesPolandPortugalRomaniaRussiaSaudi ArabiaScotlandSenegalSerbiaSierra LeoneSingaporeSomaliaSouth AfricaSouth AmericaSouth Central AsiaSouth Eastern AsiaSouthern EuropeSpainSri LankaSt. Vincent and the GrenadinesSudanSwedenSwitzerlandSyriaTaiwanThailandTrinidad and TobagoTurkeyUgandaUkraineUruguayUzbekistanVenezuelaVietnamWest IndiesWestern AfricaWestern AsiaWestern EuropeYemenZaireZimbabweAzores
Disability Age 65 to 74
Income
Poverty
Unemployment
Labor Participation
Family Structure
Vehicle Availability
Education Level
Disability

Disability Age 65 to 74 Comparison

Immigrants from Congo

Immigrants from Bahamas

Tragic
Fair
26.0%
DISABILITY AGE 65 TO 74
0.0/ 100
METRIC RATING
285th/ 347
METRIC RANK
23.7%
DISABILITY AGE 65 TO 74
23.3/ 100
METRIC RATING
202nd/ 347
METRIC RANK

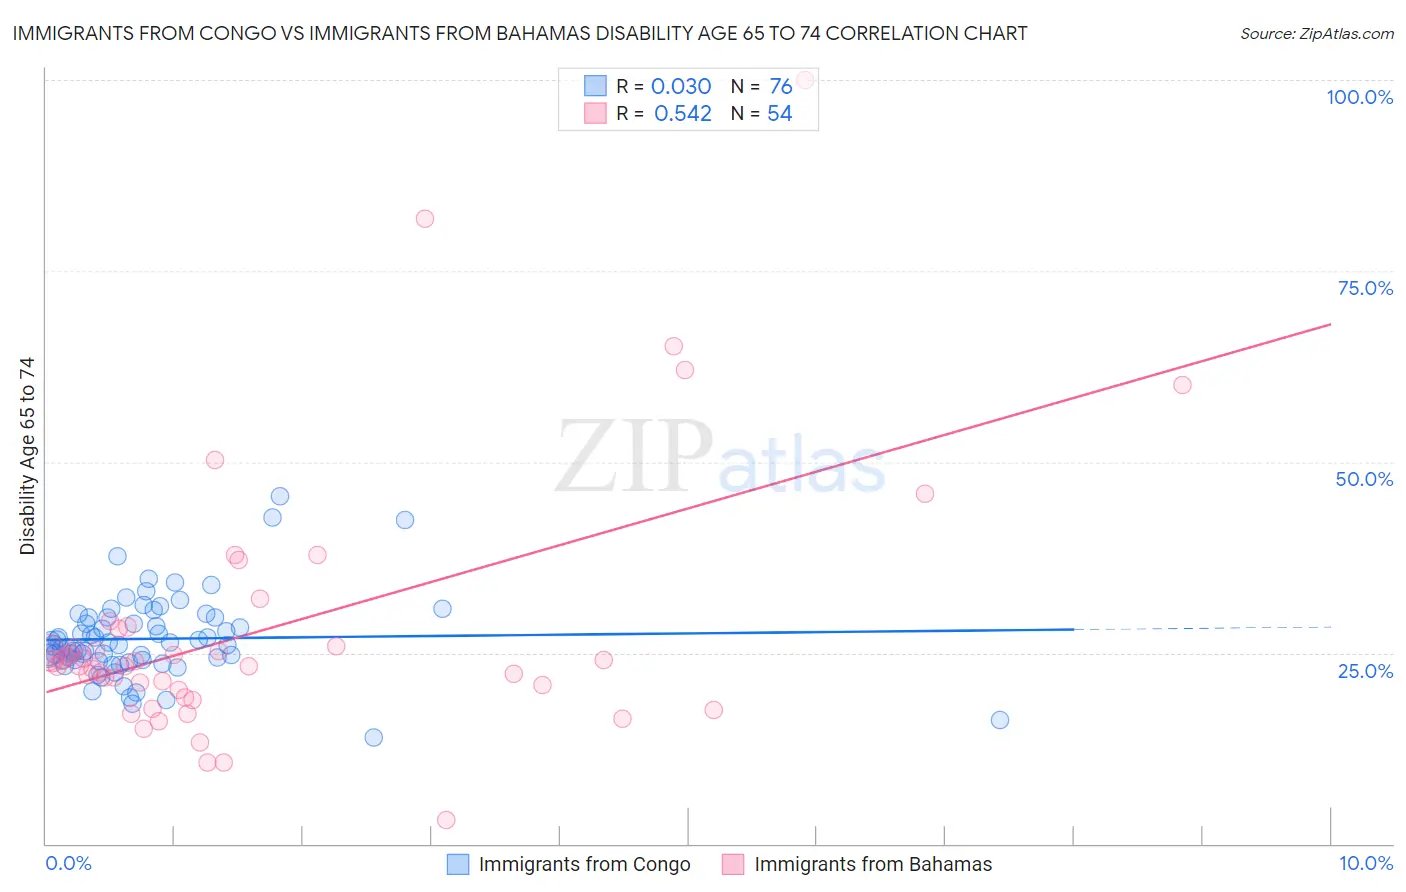
Immigrants from Congo vs Immigrants from Bahamas Disability Age 65 to 74 Correlation Chart

The statistical analysis conducted on geographies consisting of 92,066,096 people shows no correlation between the proportion of Immigrants from Congo and percentage of population with a disability between the ages 65 and 75 in the United States with a correlation coefficient (R) of 0.030 and weighted average of 26.0%. Similarly, the statistical analysis conducted on geographies consisting of 104,578,963 people shows a substantial positive correlation between the proportion of Immigrants from Bahamas and percentage of population with a disability between the ages 65 and 75 in the United States with a correlation coefficient (R) of 0.542 and weighted average of 23.7%, a difference of 9.5%.
Immigrants from Congo vs Immigrants from Bahamas Disability Age 65 to 74

Disability Age 65 to 74 Correlation Summary

MeasurementImmigrants from CongoImmigrants from Bahamas
Minimum14.0%3.1%
Maximum45.5%100.0%
Range31.5%96.9%
Mean26.8%28.1%
Median26.1%23.6%
Interquartile 25% (IQ1)24.0%20.1%
Interquartile 75% (IQ3)29.6%28.1%
Interquartile Range (IQR)5.6%7.9%
Standard Deviation (Sample)5.4%17.3%
Standard Deviation (Population)5.4%17.2%

Similar Demographics by Disability Age 65 to 74

Demographics Similar to Immigrants from Congo by Disability Age 65 to 74

In terms of disability age 65 to 74, the demographic groups most similar to Immigrants from Congo are Immigrants from the Azores (26.0%, a difference of 0.020%), Spanish American (25.9%, a difference of 0.21%), Delaware (25.9%, a difference of 0.35%), Immigrants from Honduras (25.9%, a difference of 0.42%), and Immigrants from Micronesia (26.1%, a difference of 0.43%).
DemographicsRating | RankDisability Age 65 to 74
Immigrants | Belize
0.1
/100
|
#278
Tragic
25.8%
U.S. Virgin Islanders
0.1
/100
|
#279
Tragic
25.9%
Cree
0.1
/100
|
#280
Tragic
25.9%
Immigrants | Honduras
0.1
/100
|
#281
Tragic
25.9%
Delaware
0.1
/100
|
#282
Tragic
25.9%
Spanish Americans
0.0
/100
|
#283
Tragic
25.9%
Immigrants | Azores
0.0
/100
|
#284
Tragic
26.0%
Immigrants | Congo
0.0
/100
|
#285
Tragic
26.0%
Immigrants | Micronesia
0.0
/100
|
#286
Tragic
26.1%
Immigrants | Laos
0.0
/100
|
#287
Tragic
26.1%
Mexican American Indians
0.0
/100
|
#288
Tragic
26.2%
Africans
0.0
/100
|
#289
Tragic
26.2%
Immigrants | Cabo Verde
0.0
/100
|
#290
Tragic
26.3%
Spanish American Indians
0.0
/100
|
#291
Tragic
26.4%
Blackfeet
0.0
/100
|
#292
Tragic
26.6%

Demographics Similar to Immigrants from Bahamas by Disability Age 65 to 74

In terms of disability age 65 to 74, the demographic groups most similar to Immigrants from Bahamas are Kenyan (23.7%, a difference of 0.010%), Immigrants from Ecuador (23.7%, a difference of 0.040%), French Canadian (23.7%, a difference of 0.050%), Immigrants from Africa (23.7%, a difference of 0.080%), and Welsh (23.7%, a difference of 0.080%).
DemographicsRating | RankDisability Age 65 to 74
Immigrants | St. Vincent and the Grenadines
26.1
/100
|
#195
Fair
23.7%
Immigrants | Trinidad and Tobago
26.1
/100
|
#196
Fair
23.7%
Immigrants | Immigrants
25.8
/100
|
#197
Fair
23.7%
Immigrants | Africa
24.4
/100
|
#198
Fair
23.7%
Welsh
24.3
/100
|
#199
Fair
23.7%
French Canadians
24.0
/100
|
#200
Fair
23.7%
Immigrants | Ecuador
23.9
/100
|
#201
Fair
23.7%
Immigrants | Bahamas
23.3
/100
|
#202
Fair
23.7%
Kenyans
23.2
/100
|
#203
Fair
23.7%
Immigrants | Grenada
22.1
/100
|
#204
Fair
23.8%
Tongans
20.8
/100
|
#205
Fair
23.8%
Immigrants | Jamaica
20.7
/100
|
#206
Fair
23.8%
Immigrants | Sudan
20.1
/100
|
#207
Fair
23.8%
Immigrants | Barbados
19.6
/100
|
#208
Poor
23.8%
Immigrants | Kenya
19.6
/100
|
#209
Poor
23.8%