Immigrants from Congo vs Costa Rican Median Earnings
COMPARE
Immigrants from Congo
Costa Rican
Median Earnings
Median Earnings Comparison
Immigrants from Congo
Costa Ricans
$39,169
MEDIAN EARNINGS
0.0/ 100
METRIC RATING
330th/ 347
METRIC RANK
$46,645
MEDIAN EARNINGS
57.4/ 100
METRIC RATING
167th/ 347
METRIC RANK
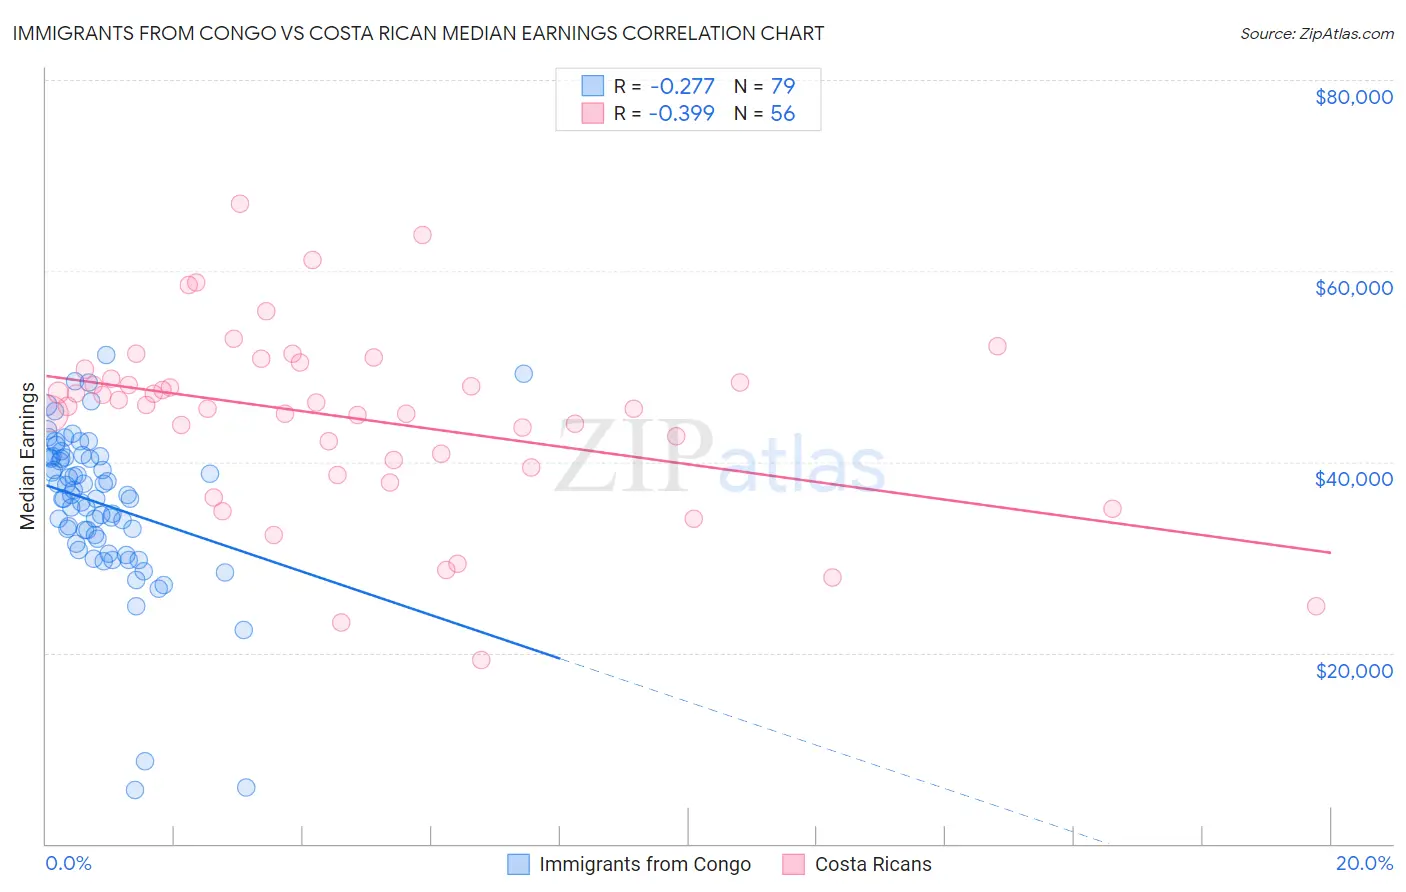
Immigrants from Congo vs Costa Rican Median Earnings Correlation Chart
The statistical analysis conducted on geographies consisting of 92,120,169 people shows a weak negative correlation between the proportion of Immigrants from Congo and median earnings in the United States with a correlation coefficient (R) of -0.277 and weighted average of $39,169. Similarly, the statistical analysis conducted on geographies consisting of 253,579,984 people shows a mild negative correlation between the proportion of Costa Ricans and median earnings in the United States with a correlation coefficient (R) of -0.399 and weighted average of $46,645, a difference of 19.1%.
Median Earnings Correlation Summary
| Measurement | Immigrants from Congo | Costa Rican |
| Minimum | $5,625 | $19,205 |
| Maximum | $51,158 | $67,102 |
| Range | $45,533 | $47,897 |
| Mean | $35,599 | $44,542 |
| Median | $36,543 | $45,923 |
| Interquartile 25% (IQ1) | $31,963 | $39,792 |
| Interquartile 75% (IQ3) | $40,520 | $49,211 |
| Interquartile Range (IQR) | $8,557 | $9,420 |
| Standard Deviation (Sample) | $8,202 | $9,601 |
| Standard Deviation (Population) | $8,150 | $9,515 |
Similar Demographics by Median Earnings
Demographics Similar to Immigrants from Congo by Median Earnings
In terms of median earnings, the demographic groups most similar to Immigrants from Congo are Immigrants from Mexico ($39,114, a difference of 0.14%), Kiowa ($39,232, a difference of 0.16%), Yakama ($39,107, a difference of 0.16%), Houma ($38,949, a difference of 0.57%), and Spanish American Indian ($38,907, a difference of 0.67%).
| Demographics | Rating | Rank | Median Earnings |
| Bahamians | 0.0 /100 | #323 | Tragic $39,735 |
| Ottawa | 0.0 /100 | #324 | Tragic $39,721 |
| Creek | 0.0 /100 | #325 | Tragic $39,648 |
| Immigrants | Yemen | 0.0 /100 | #326 | Tragic $39,540 |
| Yuman | 0.0 /100 | #327 | Tragic $39,523 |
| Sioux | 0.0 /100 | #328 | Tragic $39,448 |
| Kiowa | 0.0 /100 | #329 | Tragic $39,232 |
| Immigrants | Congo | 0.0 /100 | #330 | Tragic $39,169 |
| Immigrants | Mexico | 0.0 /100 | #331 | Tragic $39,114 |
| Yakama | 0.0 /100 | #332 | Tragic $39,107 |
| Houma | 0.0 /100 | #333 | Tragic $38,949 |
| Spanish American Indians | 0.0 /100 | #334 | Tragic $38,907 |
| Natives/Alaskans | 0.0 /100 | #335 | Tragic $38,896 |
| Crow | 0.0 /100 | #336 | Tragic $38,707 |
| Immigrants | Cuba | 0.0 /100 | #337 | Tragic $38,426 |
Demographics Similar to Costa Ricans by Median Earnings
In terms of median earnings, the demographic groups most similar to Costa Ricans are Czechoslovakian ($46,658, a difference of 0.030%), Immigrants from Africa ($46,564, a difference of 0.17%), Immigrants from South America ($46,548, a difference of 0.21%), South American ($46,804, a difference of 0.34%), and Immigrants ($46,478, a difference of 0.36%).
| Demographics | Rating | Rank | Median Earnings |
| Alsatians | 69.6 /100 | #160 | Good $47,023 |
| Immigrants | Eastern Africa | 68.0 /100 | #161 | Good $46,969 |
| South American Indians | 67.4 /100 | #162 | Good $46,952 |
| Icelanders | 66.3 /100 | #163 | Good $46,916 |
| Norwegians | 64.7 /100 | #164 | Good $46,865 |
| South Americans | 62.7 /100 | #165 | Good $46,804 |
| Czechoslovakians | 57.8 /100 | #166 | Average $46,658 |
| Costa Ricans | 57.4 /100 | #167 | Average $46,645 |
| Immigrants | Africa | 54.6 /100 | #168 | Average $46,564 |
| Immigrants | South America | 54.0 /100 | #169 | Average $46,548 |
| Immigrants | Immigrants | 51.6 /100 | #170 | Average $46,478 |
| Scottish | 51.1 /100 | #171 | Average $46,463 |
| Kenyans | 51.0 /100 | #172 | Average $46,462 |
| Ghanaians | 50.3 /100 | #173 | Average $46,440 |
| Scandinavians | 50.0 /100 | #174 | Average $46,433 |