Panamanian vs Indian (Asian) Median Female Earnings
COMPARE
Panamanian
Indian (Asian)
Median Female Earnings
Median Female Earnings Comparison
Panamanians
Indians (Asian)
$39,049
MEDIAN FEMALE EARNINGS
20.6/ 100
METRIC RATING
201st/ 347
METRIC RANK
$46,481
MEDIAN FEMALE EARNINGS
100.0/ 100
METRIC RATING
16th/ 347
METRIC RANK
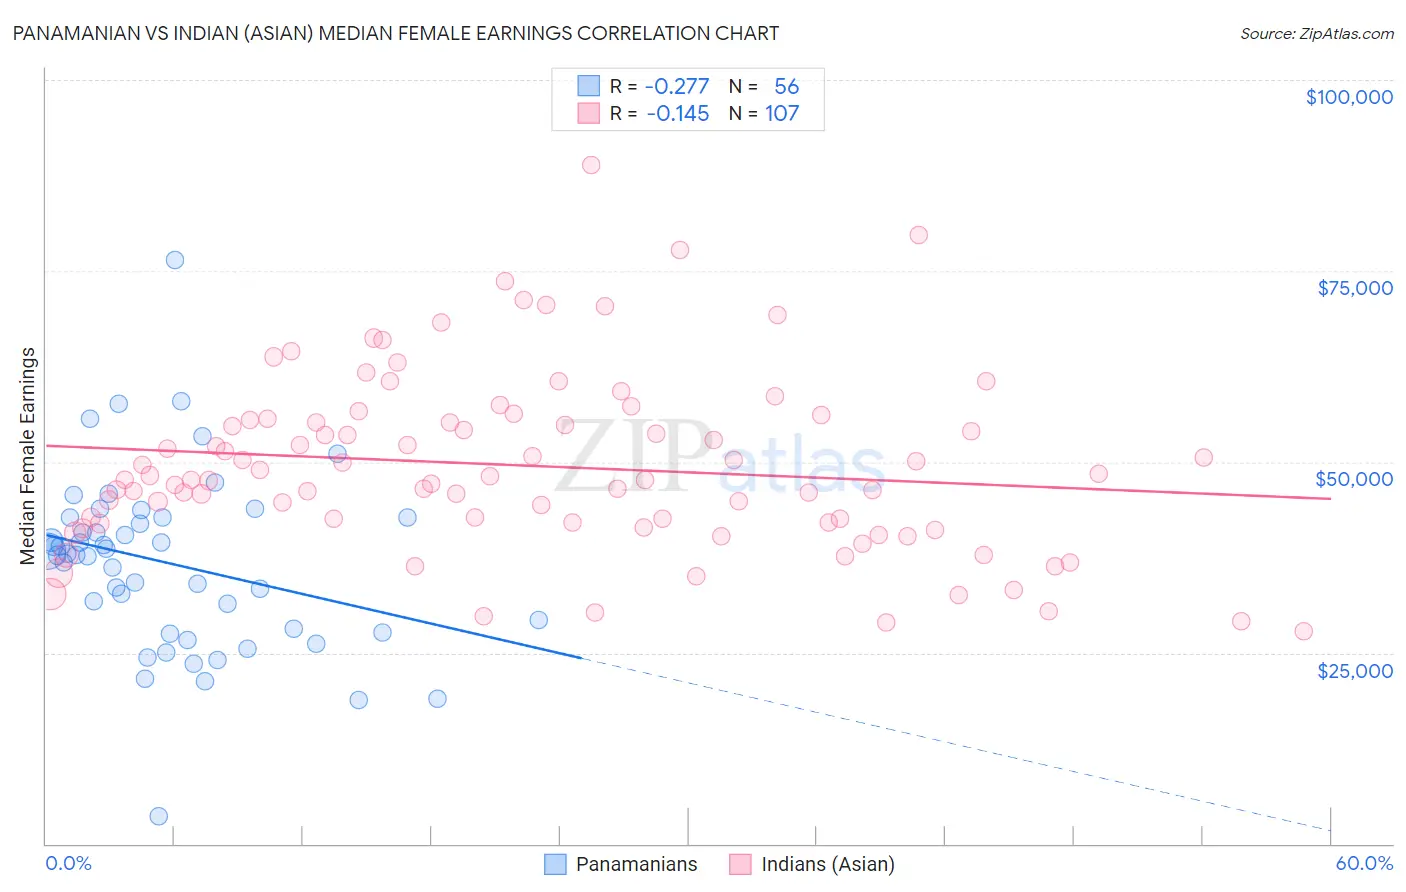
Panamanian vs Indian (Asian) Median Female Earnings Correlation Chart
The statistical analysis conducted on geographies consisting of 281,178,776 people shows a weak negative correlation between the proportion of Panamanians and median female earnings in the United States with a correlation coefficient (R) of -0.277 and weighted average of $39,049. Similarly, the statistical analysis conducted on geographies consisting of 494,787,725 people shows a poor negative correlation between the proportion of Indians (Asian) and median female earnings in the United States with a correlation coefficient (R) of -0.145 and weighted average of $46,481, a difference of 19.0%.
Median Female Earnings Correlation Summary
| Measurement | Panamanian | Indian (Asian) |
| Minimum | $3,667 | $27,791 |
| Maximum | $76,443 | $88,889 |
| Range | $72,776 | $61,098 |
| Mean | $36,686 | $49,511 |
| Median | $37,828 | $47,694 |
| Interquartile 25% (IQ1) | $27,848 | $42,024 |
| Interquartile 75% (IQ3) | $42,686 | $55,457 |
| Interquartile Range (IQR) | $14,839 | $13,433 |
| Standard Deviation (Sample) | $11,684 | $11,605 |
| Standard Deviation (Population) | $11,579 | $11,550 |
Similar Demographics by Median Female Earnings
Demographics Similar to Panamanians by Median Female Earnings
In terms of median female earnings, the demographic groups most similar to Panamanians are Immigrants from Panama ($39,049, a difference of 0.0%), Slovak ($39,029, a difference of 0.050%), Icelander ($39,109, a difference of 0.15%), Czech ($38,992, a difference of 0.15%), and Ecuadorian ($39,117, a difference of 0.17%).
| Demographics | Rating | Rank | Median Female Earnings |
| Irish | 30.0 /100 | #194 | Fair $39,291 |
| Uruguayans | 27.3 /100 | #195 | Fair $39,228 |
| Immigrants | Costa Rica | 25.6 /100 | #196 | Fair $39,186 |
| Assyrians/Chaldeans/Syriacs | 24.6 /100 | #197 | Fair $39,159 |
| Ecuadorians | 23.0 /100 | #198 | Fair $39,117 |
| Icelanders | 22.7 /100 | #199 | Fair $39,109 |
| Immigrants | Panama | 20.6 /100 | #200 | Fair $39,049 |
| Panamanians | 20.6 /100 | #201 | Fair $39,049 |
| Slovaks | 19.9 /100 | #202 | Poor $39,029 |
| Czechs | 18.7 /100 | #203 | Poor $38,992 |
| Immigrants | Uruguay | 17.3 /100 | #204 | Poor $38,945 |
| Immigrants | Colombia | 16.3 /100 | #205 | Poor $38,913 |
| Immigrants | Bosnia and Herzegovina | 15.6 /100 | #206 | Poor $38,886 |
| Immigrants | Cambodia | 14.2 /100 | #207 | Poor $38,833 |
| Immigrants | Thailand | 13.6 /100 | #208 | Poor $38,810 |
Demographics Similar to Indians (Asian) by Median Female Earnings
In terms of median female earnings, the demographic groups most similar to Indians (Asian) are Immigrants from Eastern Asia ($46,502, a difference of 0.050%), Soviet Union ($46,556, a difference of 0.16%), Immigrants from Australia ($46,573, a difference of 0.20%), Immigrants from South Central Asia ($46,324, a difference of 0.34%), and Okinawan ($46,905, a difference of 0.91%).
| Demographics | Rating | Rank | Median Female Earnings |
| Immigrants | Iran | 100.0 /100 | #9 | Exceptional $47,154 |
| Immigrants | China | 100.0 /100 | #10 | Exceptional $46,972 |
| Okinawans | 100.0 /100 | #11 | Exceptional $46,905 |
| Immigrants | Israel | 100.0 /100 | #12 | Exceptional $46,902 |
| Immigrants | Australia | 100.0 /100 | #13 | Exceptional $46,573 |
| Soviet Union | 100.0 /100 | #14 | Exceptional $46,556 |
| Immigrants | Eastern Asia | 100.0 /100 | #15 | Exceptional $46,502 |
| Indians (Asian) | 100.0 /100 | #16 | Exceptional $46,481 |
| Immigrants | South Central Asia | 100.0 /100 | #17 | Exceptional $46,324 |
| Cypriots | 100.0 /100 | #18 | Exceptional $45,570 |
| Eastern Europeans | 100.0 /100 | #19 | Exceptional $45,385 |
| Immigrants | Japan | 100.0 /100 | #20 | Exceptional $45,323 |
| Cambodians | 100.0 /100 | #21 | Exceptional $45,014 |
| Immigrants | Greece | 100.0 /100 | #22 | Exceptional $44,976 |
| Burmese | 100.0 /100 | #23 | Exceptional $44,911 |