Yakama vs Indian (Asian) Median Female Earnings
COMPARE
Yakama
Indian (Asian)
Median Female Earnings
Median Female Earnings Comparison
Yakama
Indians (Asian)
$33,354
MEDIAN FEMALE EARNINGS
0.0/ 100
METRIC RATING
337th/ 347
METRIC RANK
$46,481
MEDIAN FEMALE EARNINGS
100.0/ 100
METRIC RATING
16th/ 347
METRIC RANK
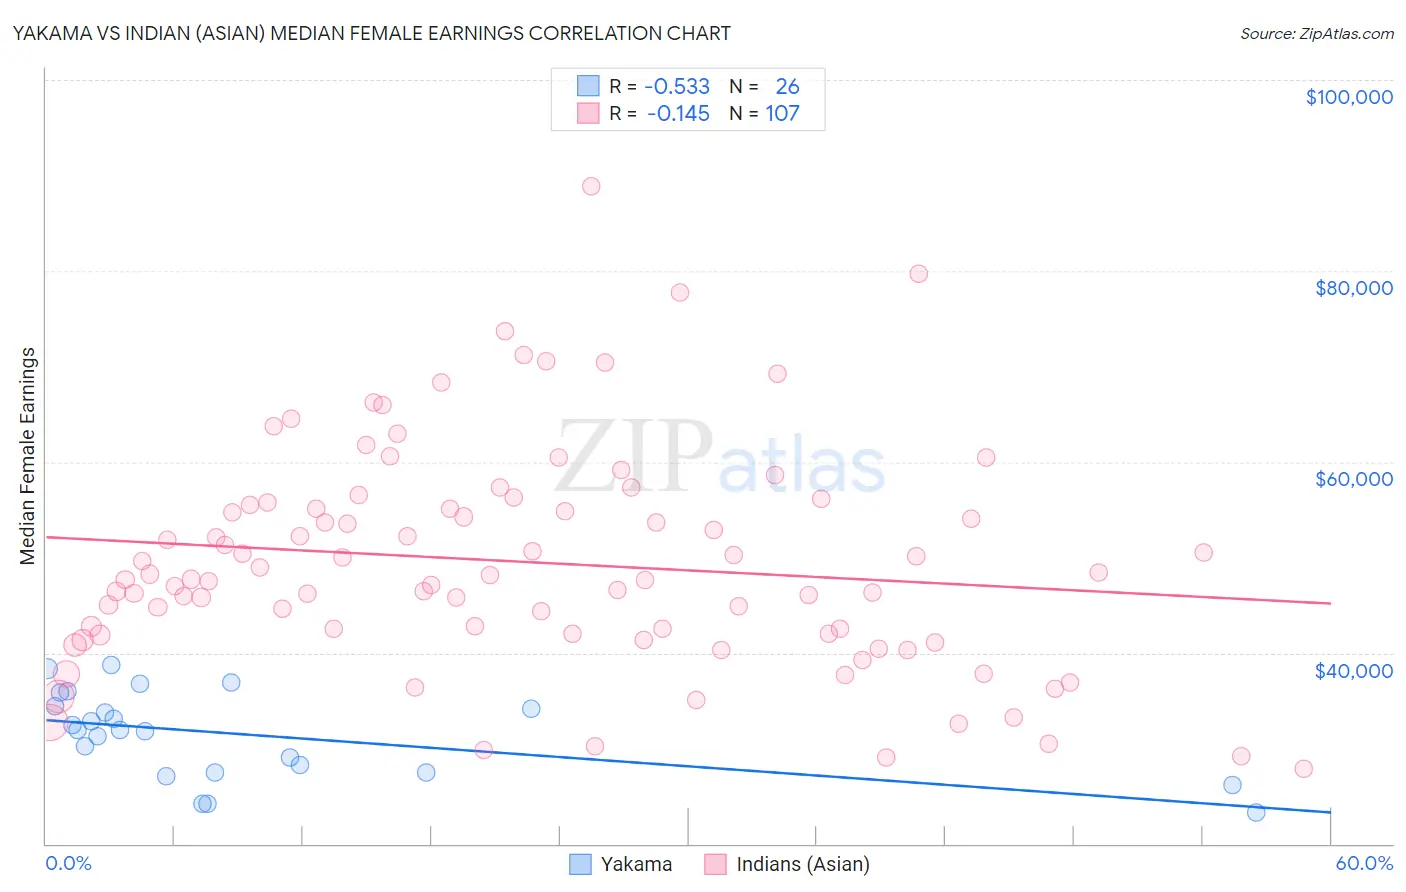
Yakama vs Indian (Asian) Median Female Earnings Correlation Chart
The statistical analysis conducted on geographies consisting of 19,910,730 people shows a substantial negative correlation between the proportion of Yakama and median female earnings in the United States with a correlation coefficient (R) of -0.533 and weighted average of $33,354. Similarly, the statistical analysis conducted on geographies consisting of 494,787,725 people shows a poor negative correlation between the proportion of Indians (Asian) and median female earnings in the United States with a correlation coefficient (R) of -0.145 and weighted average of $46,481, a difference of 39.4%.
Median Female Earnings Correlation Summary
| Measurement | Yakama | Indian (Asian) |
| Minimum | $23,214 | $27,791 |
| Maximum | $38,750 | $88,889 |
| Range | $15,536 | $61,098 |
| Mean | $31,429 | $49,511 |
| Median | $31,931 | $47,694 |
| Interquartile 25% (IQ1) | $27,516 | $42,024 |
| Interquartile 75% (IQ3) | $34,456 | $55,457 |
| Interquartile Range (IQR) | $6,940 | $13,433 |
| Standard Deviation (Sample) | $4,456 | $11,605 |
| Standard Deviation (Population) | $4,370 | $11,550 |
Similar Demographics by Median Female Earnings
Demographics Similar to Yakama by Median Female Earnings
In terms of median female earnings, the demographic groups most similar to Yakama are Ottawa ($33,378, a difference of 0.070%), Immigrants from Cuba ($33,291, a difference of 0.19%), Creek ($33,437, a difference of 0.25%), Immigrants from Mexico ($33,236, a difference of 0.36%), and Tohono O'odham ($33,205, a difference of 0.45%).
| Demographics | Rating | Rank | Median Female Earnings |
| Menominee | 0.0 /100 | #330 | Tragic $33,894 |
| Natives/Alaskans | 0.0 /100 | #331 | Tragic $33,806 |
| Choctaw | 0.0 /100 | #332 | Tragic $33,775 |
| Mexicans | 0.0 /100 | #333 | Tragic $33,664 |
| Spanish American Indians | 0.0 /100 | #334 | Tragic $33,625 |
| Creek | 0.0 /100 | #335 | Tragic $33,437 |
| Ottawa | 0.0 /100 | #336 | Tragic $33,378 |
| Yakama | 0.0 /100 | #337 | Tragic $33,354 |
| Immigrants | Cuba | 0.0 /100 | #338 | Tragic $33,291 |
| Immigrants | Mexico | 0.0 /100 | #339 | Tragic $33,236 |
| Tohono O'odham | 0.0 /100 | #340 | Tragic $33,205 |
| Navajo | 0.0 /100 | #341 | Tragic $33,046 |
| Yup'ik | 0.0 /100 | #342 | Tragic $32,730 |
| Pueblo | 0.0 /100 | #343 | Tragic $32,564 |
| Lumbee | 0.0 /100 | #344 | Tragic $32,500 |
Demographics Similar to Indians (Asian) by Median Female Earnings
In terms of median female earnings, the demographic groups most similar to Indians (Asian) are Immigrants from Eastern Asia ($46,502, a difference of 0.050%), Soviet Union ($46,556, a difference of 0.16%), Immigrants from Australia ($46,573, a difference of 0.20%), Immigrants from South Central Asia ($46,324, a difference of 0.34%), and Okinawan ($46,905, a difference of 0.91%).
| Demographics | Rating | Rank | Median Female Earnings |
| Immigrants | Iran | 100.0 /100 | #9 | Exceptional $47,154 |
| Immigrants | China | 100.0 /100 | #10 | Exceptional $46,972 |
| Okinawans | 100.0 /100 | #11 | Exceptional $46,905 |
| Immigrants | Israel | 100.0 /100 | #12 | Exceptional $46,902 |
| Immigrants | Australia | 100.0 /100 | #13 | Exceptional $46,573 |
| Soviet Union | 100.0 /100 | #14 | Exceptional $46,556 |
| Immigrants | Eastern Asia | 100.0 /100 | #15 | Exceptional $46,502 |
| Indians (Asian) | 100.0 /100 | #16 | Exceptional $46,481 |
| Immigrants | South Central Asia | 100.0 /100 | #17 | Exceptional $46,324 |
| Cypriots | 100.0 /100 | #18 | Exceptional $45,570 |
| Eastern Europeans | 100.0 /100 | #19 | Exceptional $45,385 |
| Immigrants | Japan | 100.0 /100 | #20 | Exceptional $45,323 |
| Cambodians | 100.0 /100 | #21 | Exceptional $45,014 |
| Immigrants | Greece | 100.0 /100 | #22 | Exceptional $44,976 |
| Burmese | 100.0 /100 | #23 | Exceptional $44,911 |