Sudanese vs Dutch Median Female Earnings
COMPARE
Sudanese
Dutch
Median Female Earnings
Median Female Earnings Comparison
Sudanese
Dutch
$38,215
MEDIAN FEMALE EARNINGS
4.4/ 100
METRIC RATING
235th/ 347
METRIC RANK
$37,339
MEDIAN FEMALE EARNINGS
0.7/ 100
METRIC RATING
260th/ 347
METRIC RANK
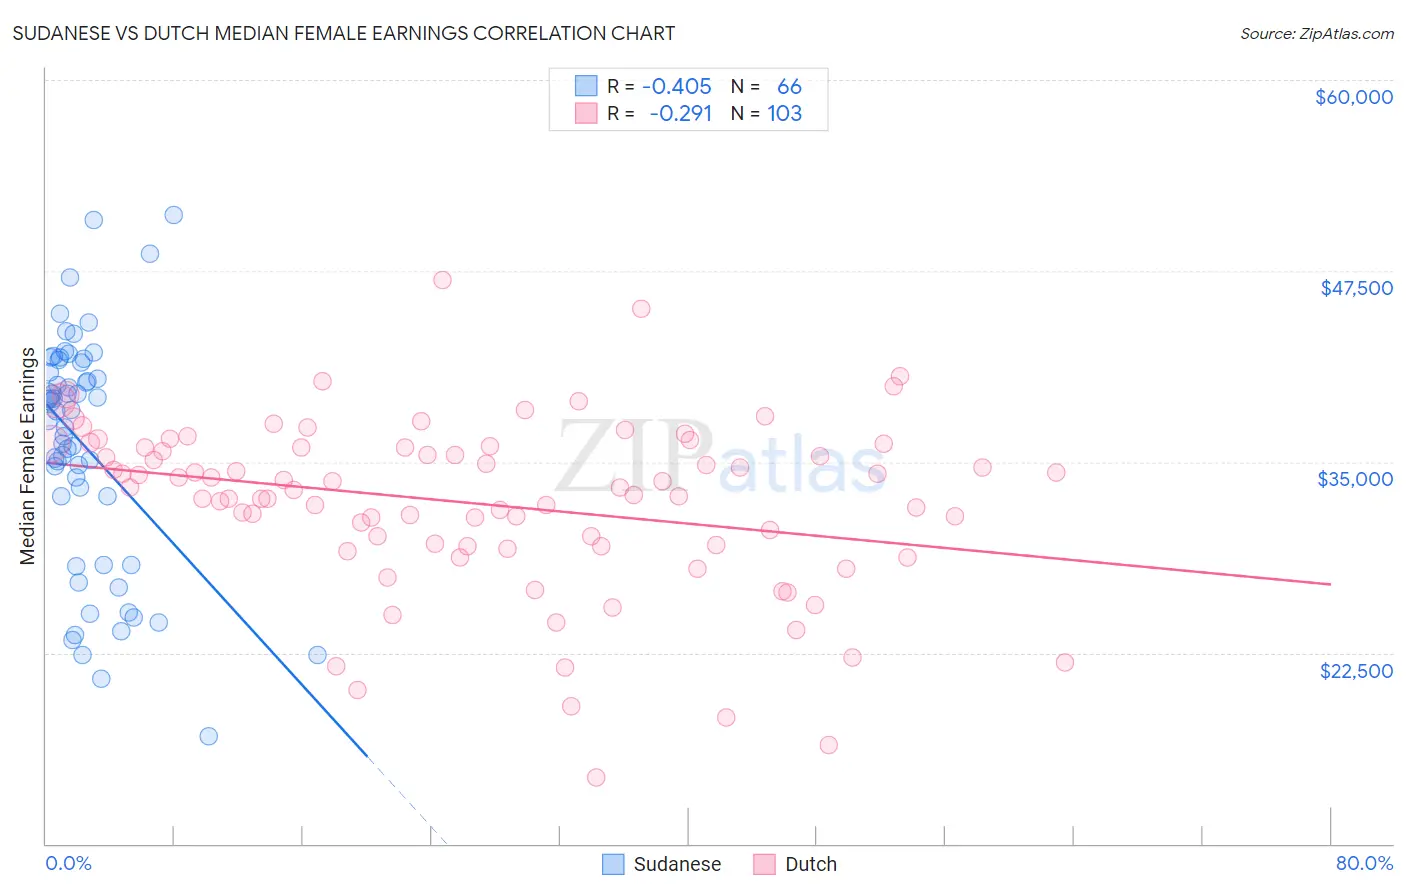
Sudanese vs Dutch Median Female Earnings Correlation Chart
The statistical analysis conducted on geographies consisting of 110,138,863 people shows a moderate negative correlation between the proportion of Sudanese and median female earnings in the United States with a correlation coefficient (R) of -0.405 and weighted average of $38,215. Similarly, the statistical analysis conducted on geographies consisting of 553,021,757 people shows a weak negative correlation between the proportion of Dutch and median female earnings in the United States with a correlation coefficient (R) of -0.291 and weighted average of $37,339, a difference of 2.4%.
Median Female Earnings Correlation Summary
| Measurement | Sudanese | Dutch |
| Minimum | $17,051 | $14,375 |
| Maximum | $51,172 | $46,907 |
| Range | $34,121 | $32,532 |
| Mean | $36,010 | $32,260 |
| Median | $38,359 | $33,299 |
| Interquartile 25% (IQ1) | $32,734 | $29,508 |
| Interquartile 75% (IQ3) | $41,525 | $35,979 |
| Interquartile Range (IQR) | $8,791 | $6,471 |
| Standard Deviation (Sample) | $7,666 | $5,704 |
| Standard Deviation (Population) | $7,607 | $5,676 |
Similar Demographics by Median Female Earnings
Demographics Similar to Sudanese by Median Female Earnings
In terms of median female earnings, the demographic groups most similar to Sudanese are Liberian ($38,215, a difference of 0.0%), Immigrants from Cabo Verde ($38,208, a difference of 0.020%), Alaska Native ($38,202, a difference of 0.040%), English ($38,196, a difference of 0.050%), and Finnish ($38,173, a difference of 0.11%).
| Demographics | Rating | Rank | Median Female Earnings |
| Sub-Saharan Africans | 6.2 /100 | #228 | Tragic $38,391 |
| Belgians | 6.1 /100 | #229 | Tragic $38,382 |
| Basques | 5.7 /100 | #230 | Tragic $38,352 |
| Somalis | 5.5 /100 | #231 | Tragic $38,333 |
| Scandinavians | 5.2 /100 | #232 | Tragic $38,306 |
| Tongans | 5.1 /100 | #233 | Tragic $38,288 |
| Celtics | 5.0 /100 | #234 | Tragic $38,283 |
| Sudanese | 4.4 /100 | #235 | Tragic $38,215 |
| Liberians | 4.4 /100 | #236 | Tragic $38,215 |
| Immigrants | Cabo Verde | 4.3 /100 | #237 | Tragic $38,208 |
| Alaska Natives | 4.3 /100 | #238 | Tragic $38,202 |
| English | 4.2 /100 | #239 | Tragic $38,196 |
| Finns | 4.0 /100 | #240 | Tragic $38,173 |
| Spanish | 3.5 /100 | #241 | Tragic $38,098 |
| Immigrants | Burma/Myanmar | 3.0 /100 | #242 | Tragic $38,028 |
Demographics Similar to Dutch by Median Female Earnings
In terms of median female earnings, the demographic groups most similar to Dutch are Malaysian ($37,298, a difference of 0.11%), Scotch-Irish ($37,383, a difference of 0.12%), Venezuelan ($37,282, a difference of 0.15%), Belizean ($37,429, a difference of 0.24%), and Hawaiian ($37,497, a difference of 0.42%).
| Demographics | Rating | Rank | Median Female Earnings |
| Danes | 1.6 /100 | #253 | Tragic $37,730 |
| Whites/Caucasians | 1.1 /100 | #254 | Tragic $37,531 |
| Colville | 1.1 /100 | #255 | Tragic $37,514 |
| Samoans | 1.0 /100 | #256 | Tragic $37,498 |
| Hawaiians | 1.0 /100 | #257 | Tragic $37,497 |
| Belizeans | 0.9 /100 | #258 | Tragic $37,429 |
| Scotch-Irish | 0.8 /100 | #259 | Tragic $37,383 |
| Dutch | 0.7 /100 | #260 | Tragic $37,339 |
| Malaysians | 0.7 /100 | #261 | Tragic $37,298 |
| Venezuelans | 0.7 /100 | #262 | Tragic $37,282 |
| German Russians | 0.5 /100 | #263 | Tragic $37,105 |
| Salvadorans | 0.4 /100 | #264 | Tragic $37,083 |
| Immigrants | Belize | 0.4 /100 | #265 | Tragic $37,056 |
| Dominicans | 0.4 /100 | #266 | Tragic $37,046 |
| Immigrants | Nonimmigrants | 0.4 /100 | #267 | Tragic $37,024 |