Immigrants from Caribbean vs Dutch Median Female Earnings
COMPARE
Immigrants from Caribbean
Dutch
Median Female Earnings
Median Female Earnings Comparison
Immigrants from Caribbean
Dutch
$36,414
MEDIAN FEMALE EARNINGS
0.1/ 100
METRIC RATING
279th/ 347
METRIC RANK
$37,339
MEDIAN FEMALE EARNINGS
0.7/ 100
METRIC RATING
260th/ 347
METRIC RANK
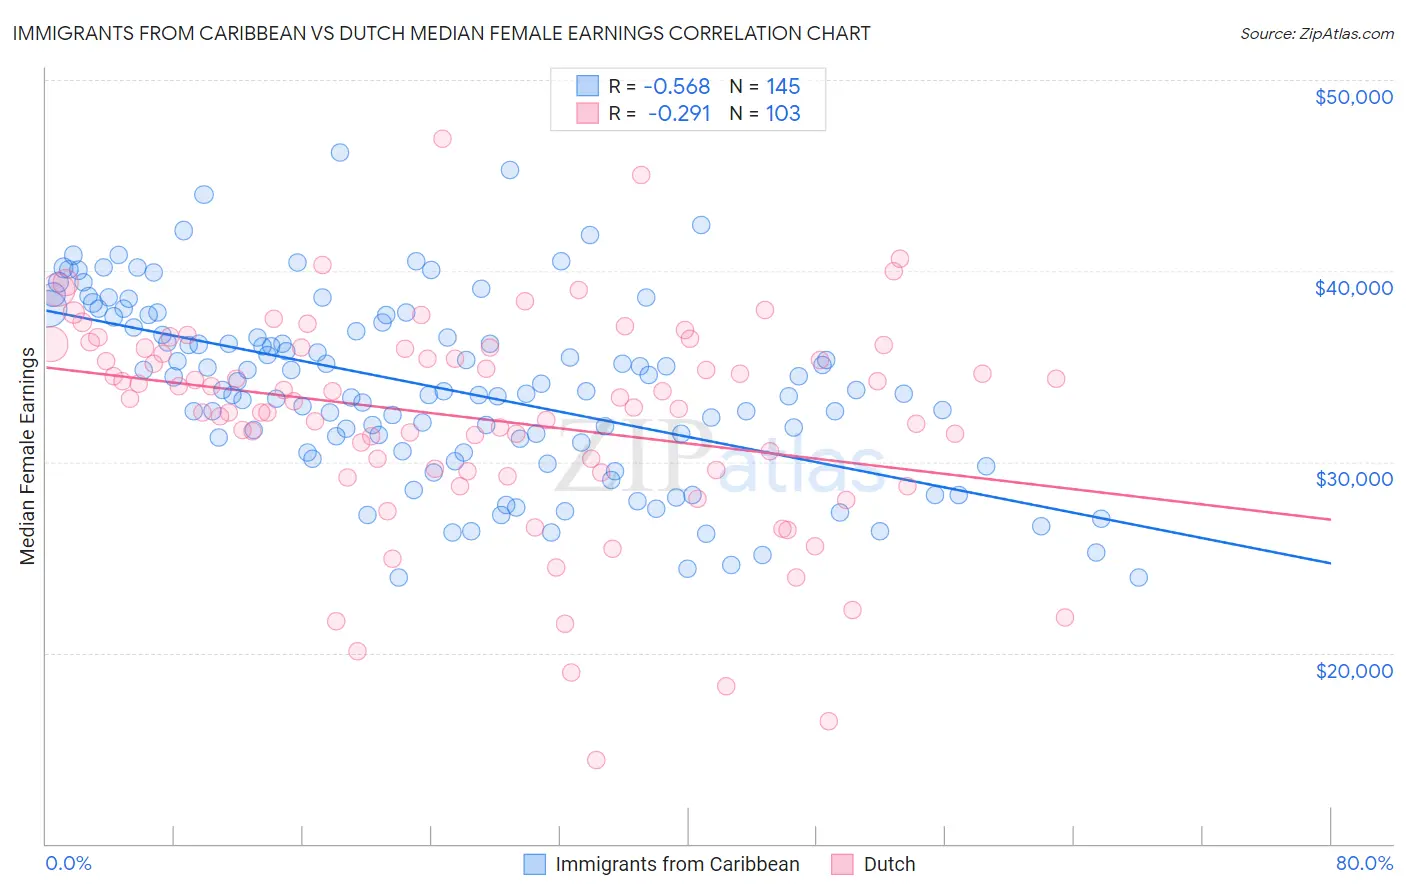
Immigrants from Caribbean vs Dutch Median Female Earnings Correlation Chart
The statistical analysis conducted on geographies consisting of 449,719,186 people shows a substantial negative correlation between the proportion of Immigrants from Caribbean and median female earnings in the United States with a correlation coefficient (R) of -0.568 and weighted average of $36,414. Similarly, the statistical analysis conducted on geographies consisting of 553,021,757 people shows a weak negative correlation between the proportion of Dutch and median female earnings in the United States with a correlation coefficient (R) of -0.291 and weighted average of $37,339, a difference of 2.5%.
Median Female Earnings Correlation Summary
| Measurement | Immigrants from Caribbean | Dutch |
| Minimum | $23,937 | $14,375 |
| Maximum | $46,205 | $46,907 |
| Range | $22,268 | $32,532 |
| Mean | $33,887 | $32,260 |
| Median | $33,768 | $33,299 |
| Interquartile 25% (IQ1) | $30,791 | $29,508 |
| Interquartile 75% (IQ3) | $37,444 | $35,979 |
| Interquartile Range (IQR) | $6,654 | $6,471 |
| Standard Deviation (Sample) | $4,730 | $5,704 |
| Standard Deviation (Population) | $4,714 | $5,676 |
Demographics Similar to Immigrants from Caribbean and Dutch by Median Female Earnings
In terms of median female earnings, the demographic groups most similar to Immigrants from Caribbean are U.S. Virgin Islander ($36,424, a difference of 0.030%), Marshallese ($36,459, a difference of 0.12%), Central American ($36,492, a difference of 0.22%), African ($36,530, a difference of 0.32%), and Immigrants from El Salvador ($36,673, a difference of 0.71%). Similarly, the demographic groups most similar to Dutch are Malaysian ($37,298, a difference of 0.11%), Scotch-Irish ($37,383, a difference of 0.12%), Venezuelan ($37,282, a difference of 0.15%), German Russian ($37,105, a difference of 0.63%), and Salvadoran ($37,083, a difference of 0.69%).
| Demographics | Rating | Rank | Median Female Earnings |
| Scotch-Irish | 0.8 /100 | #259 | Tragic $37,383 |
| Dutch | 0.7 /100 | #260 | Tragic $37,339 |
| Malaysians | 0.7 /100 | #261 | Tragic $37,298 |
| Venezuelans | 0.7 /100 | #262 | Tragic $37,282 |
| German Russians | 0.5 /100 | #263 | Tragic $37,105 |
| Salvadorans | 0.4 /100 | #264 | Tragic $37,083 |
| Immigrants | Belize | 0.4 /100 | #265 | Tragic $37,056 |
| Dominicans | 0.4 /100 | #266 | Tragic $37,046 |
| Immigrants | Nonimmigrants | 0.4 /100 | #267 | Tragic $37,024 |
| Cree | 0.4 /100 | #268 | Tragic $37,018 |
| Immigrants | Venezuela | 0.4 /100 | #269 | Tragic $37,003 |
| French American Indians | 0.3 /100 | #270 | Tragic $36,920 |
| Nicaraguans | 0.3 /100 | #271 | Tragic $36,904 |
| Immigrants | Dominican Republic | 0.3 /100 | #272 | Tragic $36,857 |
| Immigrants | Laos | 0.3 /100 | #273 | Tragic $36,841 |
| Immigrants | El Salvador | 0.2 /100 | #274 | Tragic $36,673 |
| Africans | 0.1 /100 | #275 | Tragic $36,530 |
| Central Americans | 0.1 /100 | #276 | Tragic $36,492 |
| Marshallese | 0.1 /100 | #277 | Tragic $36,459 |
| U.S. Virgin Islanders | 0.1 /100 | #278 | Tragic $36,424 |
| Immigrants | Caribbean | 0.1 /100 | #279 | Tragic $36,414 |