Immigrants from Belize vs Dutch Median Female Earnings
COMPARE
Immigrants from Belize
Dutch
Median Female Earnings
Median Female Earnings Comparison
Immigrants from Belize
Dutch
$37,056
MEDIAN FEMALE EARNINGS
0.4/ 100
METRIC RATING
265th/ 347
METRIC RANK
$37,339
MEDIAN FEMALE EARNINGS
0.7/ 100
METRIC RATING
260th/ 347
METRIC RANK
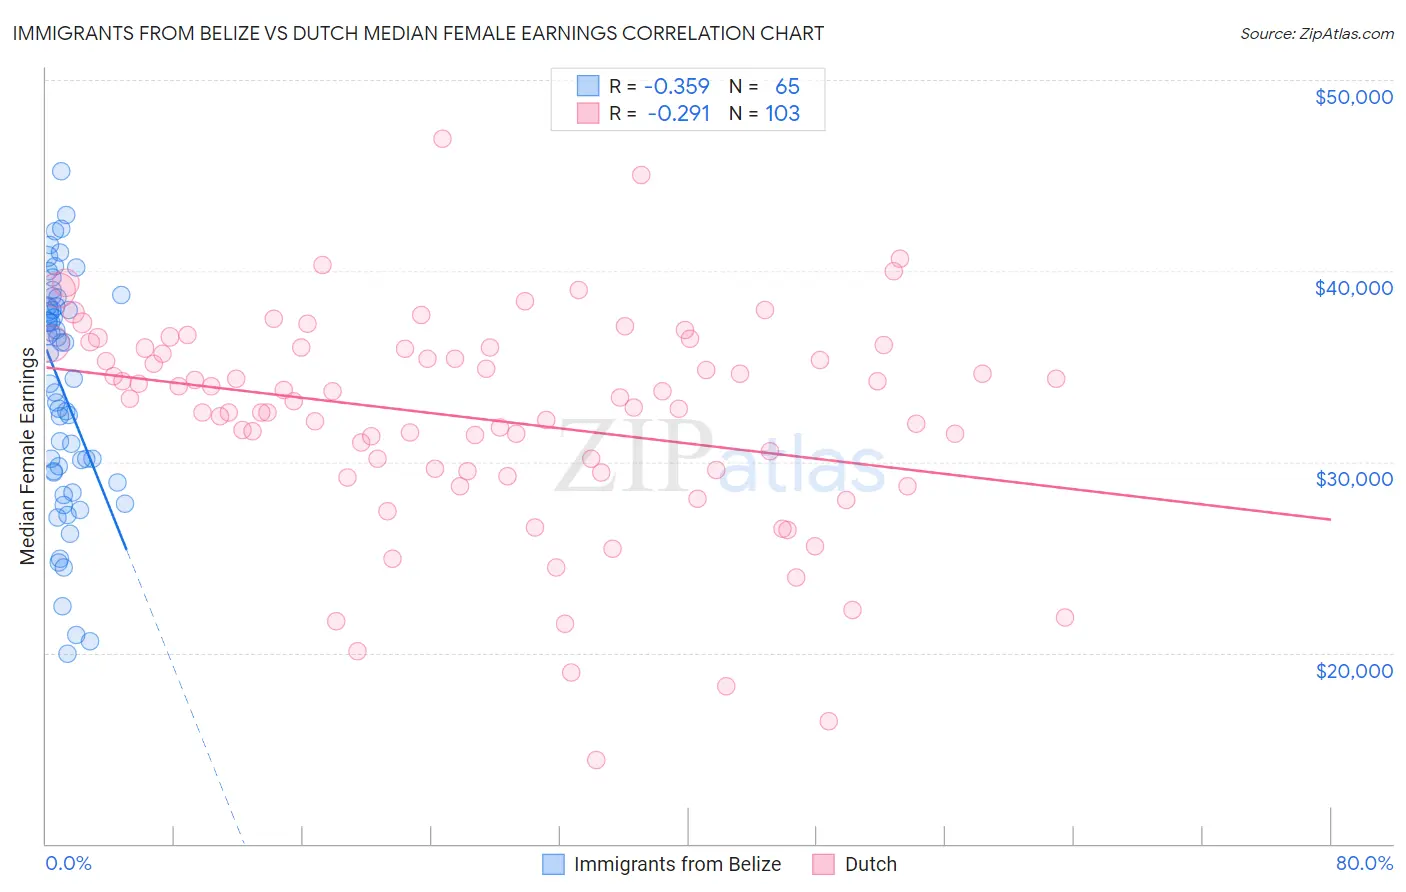
Immigrants from Belize vs Dutch Median Female Earnings Correlation Chart
The statistical analysis conducted on geographies consisting of 130,285,587 people shows a mild negative correlation between the proportion of Immigrants from Belize and median female earnings in the United States with a correlation coefficient (R) of -0.359 and weighted average of $37,056. Similarly, the statistical analysis conducted on geographies consisting of 553,021,757 people shows a weak negative correlation between the proportion of Dutch and median female earnings in the United States with a correlation coefficient (R) of -0.291 and weighted average of $37,339, a difference of 0.76%.
Median Female Earnings Correlation Summary
| Measurement | Immigrants from Belize | Dutch |
| Minimum | $19,964 | $14,375 |
| Maximum | $45,241 | $46,907 |
| Range | $25,277 | $32,532 |
| Mean | $33,651 | $32,260 |
| Median | $34,358 | $33,299 |
| Interquartile 25% (IQ1) | $29,185 | $29,508 |
| Interquartile 75% (IQ3) | $38,173 | $35,979 |
| Interquartile Range (IQR) | $8,989 | $6,471 |
| Standard Deviation (Sample) | $6,058 | $5,704 |
| Standard Deviation (Population) | $6,012 | $5,676 |
Demographics Similar to Immigrants from Belize and Dutch by Median Female Earnings
In terms of median female earnings, the demographic groups most similar to Immigrants from Belize are Dominican ($37,046, a difference of 0.030%), Salvadoran ($37,083, a difference of 0.070%), Nonimmigrants ($37,024, a difference of 0.090%), Cree ($37,018, a difference of 0.10%), and German Russian ($37,105, a difference of 0.13%). Similarly, the demographic groups most similar to Dutch are Malaysian ($37,298, a difference of 0.11%), Scotch-Irish ($37,383, a difference of 0.12%), Venezuelan ($37,282, a difference of 0.15%), Belizean ($37,429, a difference of 0.24%), and Hawaiian ($37,497, a difference of 0.42%).
| Demographics | Rating | Rank | Median Female Earnings |
| Immigrants | Dominica | 2.0 /100 | #252 | Tragic $37,825 |
| Danes | 1.6 /100 | #253 | Tragic $37,730 |
| Whites/Caucasians | 1.1 /100 | #254 | Tragic $37,531 |
| Colville | 1.1 /100 | #255 | Tragic $37,514 |
| Samoans | 1.0 /100 | #256 | Tragic $37,498 |
| Hawaiians | 1.0 /100 | #257 | Tragic $37,497 |
| Belizeans | 0.9 /100 | #258 | Tragic $37,429 |
| Scotch-Irish | 0.8 /100 | #259 | Tragic $37,383 |
| Dutch | 0.7 /100 | #260 | Tragic $37,339 |
| Malaysians | 0.7 /100 | #261 | Tragic $37,298 |
| Venezuelans | 0.7 /100 | #262 | Tragic $37,282 |
| German Russians | 0.5 /100 | #263 | Tragic $37,105 |
| Salvadorans | 0.4 /100 | #264 | Tragic $37,083 |
| Immigrants | Belize | 0.4 /100 | #265 | Tragic $37,056 |
| Dominicans | 0.4 /100 | #266 | Tragic $37,046 |
| Immigrants | Nonimmigrants | 0.4 /100 | #267 | Tragic $37,024 |
| Cree | 0.4 /100 | #268 | Tragic $37,018 |
| Immigrants | Venezuela | 0.4 /100 | #269 | Tragic $37,003 |
| French American Indians | 0.3 /100 | #270 | Tragic $36,920 |
| Nicaraguans | 0.3 /100 | #271 | Tragic $36,904 |
| Immigrants | Dominican Republic | 0.3 /100 | #272 | Tragic $36,857 |