Immigrants from Belize vs Cape Verdean Median Earnings
COMPARE
Immigrants from Belize
Cape Verdean
Median Earnings
Median Earnings Comparison
Immigrants from Belize
Cape Verdeans
$42,339
MEDIAN EARNINGS
0.3/ 100
METRIC RATING
275th/ 347
METRIC RANK
$44,640
MEDIAN EARNINGS
7.5/ 100
METRIC RATING
234th/ 347
METRIC RANK
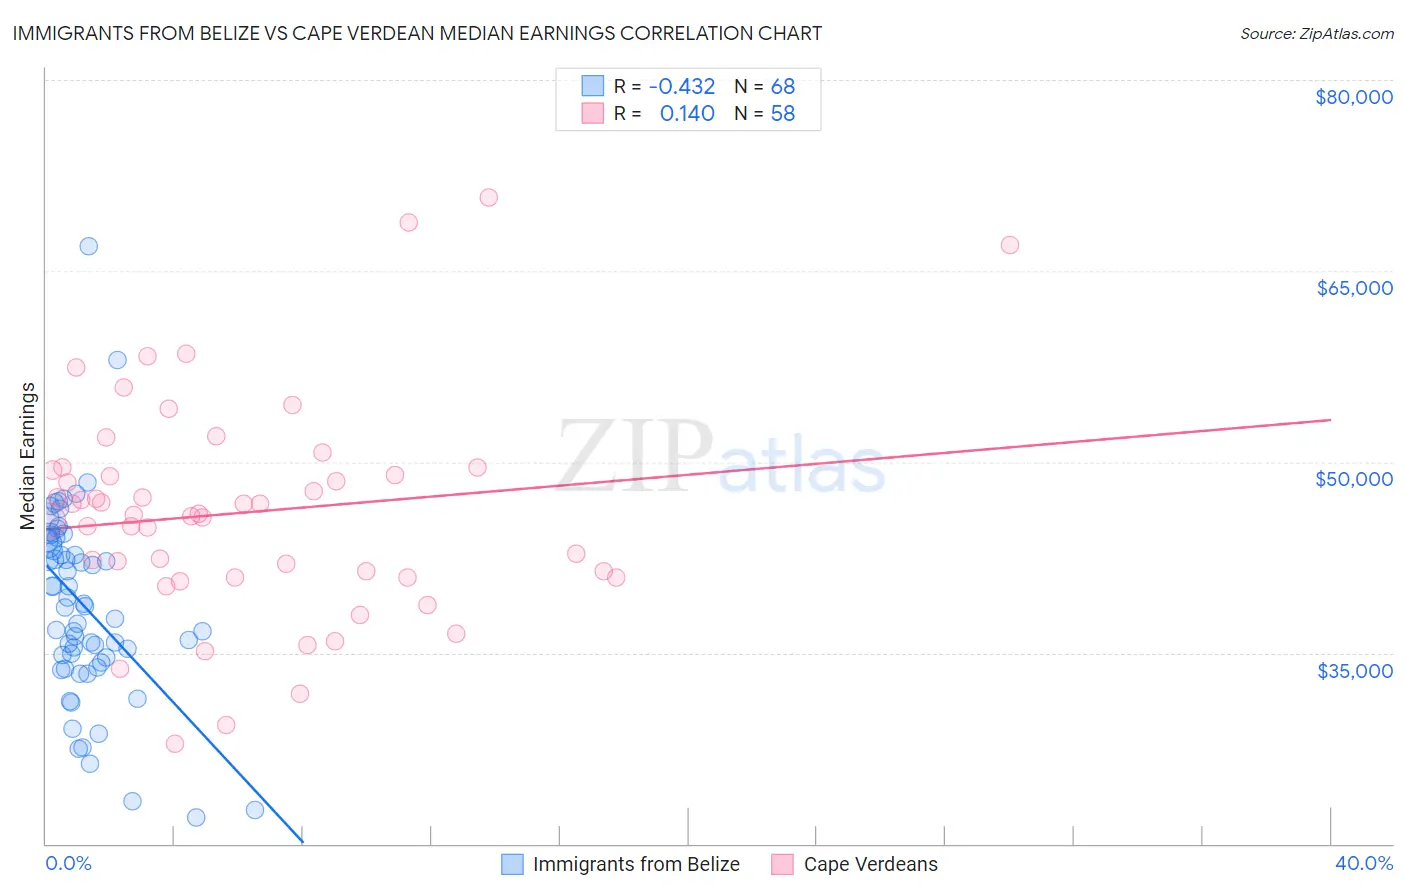
Immigrants from Belize vs Cape Verdean Median Earnings Correlation Chart
The statistical analysis conducted on geographies consisting of 130,311,555 people shows a moderate negative correlation between the proportion of Immigrants from Belize and median earnings in the United States with a correlation coefficient (R) of -0.432 and weighted average of $42,339. Similarly, the statistical analysis conducted on geographies consisting of 107,579,856 people shows a poor positive correlation between the proportion of Cape Verdeans and median earnings in the United States with a correlation coefficient (R) of 0.140 and weighted average of $44,640, a difference of 5.4%.
Median Earnings Correlation Summary
| Measurement | Immigrants from Belize | Cape Verdean |
| Minimum | $22,042 | $27,841 |
| Maximum | $66,975 | $70,758 |
| Range | $44,933 | $42,917 |
| Mean | $38,697 | $46,038 |
| Median | $38,598 | $45,876 |
| Interquartile 25% (IQ1) | $34,404 | $40,962 |
| Interquartile 75% (IQ3) | $43,711 | $49,336 |
| Interquartile Range (IQR) | $9,306 | $8,374 |
| Standard Deviation (Sample) | $7,646 | $8,551 |
| Standard Deviation (Population) | $7,590 | $8,477 |
Similar Demographics by Median Earnings
Demographics Similar to Immigrants from Belize by Median Earnings
In terms of median earnings, the demographic groups most similar to Immigrants from Belize are Spanish American ($42,316, a difference of 0.060%), Central American ($42,280, a difference of 0.14%), Immigrants from El Salvador ($42,413, a difference of 0.18%), Immigrants from Dominica ($42,420, a difference of 0.19%), and Iroquois ($42,430, a difference of 0.22%).
| Demographics | Rating | Rank | Median Earnings |
| Americans | 0.6 /100 | #268 | Tragic $42,742 |
| Belizeans | 0.5 /100 | #269 | Tragic $42,702 |
| Osage | 0.5 /100 | #270 | Tragic $42,651 |
| Pennsylvania Germans | 0.5 /100 | #271 | Tragic $42,615 |
| Iroquois | 0.4 /100 | #272 | Tragic $42,430 |
| Immigrants | Dominica | 0.4 /100 | #273 | Tragic $42,420 |
| Immigrants | El Salvador | 0.4 /100 | #274 | Tragic $42,413 |
| Immigrants | Belize | 0.3 /100 | #275 | Tragic $42,339 |
| Spanish Americans | 0.3 /100 | #276 | Tragic $42,316 |
| Central Americans | 0.3 /100 | #277 | Tragic $42,280 |
| Cajuns | 0.3 /100 | #278 | Tragic $42,189 |
| Colville | 0.2 /100 | #279 | Tragic $42,151 |
| Hmong | 0.2 /100 | #280 | Tragic $42,111 |
| Marshallese | 0.2 /100 | #281 | Tragic $41,969 |
| Africans | 0.2 /100 | #282 | Tragic $41,955 |
Demographics Similar to Cape Verdeans by Median Earnings
In terms of median earnings, the demographic groups most similar to Cape Verdeans are Venezuelan ($44,580, a difference of 0.14%), British West Indian ($44,552, a difference of 0.20%), Immigrants from Sudan ($44,767, a difference of 0.28%), Delaware ($44,783, a difference of 0.32%), and Immigrants from Ecuador ($44,462, a difference of 0.40%).
| Demographics | Rating | Rank | Median Earnings |
| Native Hawaiians | 12.2 /100 | #227 | Poor $45,027 |
| Immigrants | Iraq | 11.6 /100 | #228 | Poor $44,988 |
| Scotch-Irish | 10.7 /100 | #229 | Poor $44,924 |
| Immigrants | Western Africa | 10.3 /100 | #230 | Poor $44,893 |
| Japanese | 9.5 /100 | #231 | Tragic $44,825 |
| Delaware | 9.0 /100 | #232 | Tragic $44,783 |
| Immigrants | Sudan | 8.8 /100 | #233 | Tragic $44,767 |
| Cape Verdeans | 7.5 /100 | #234 | Tragic $44,640 |
| Venezuelans | 6.9 /100 | #235 | Tragic $44,580 |
| British West Indians | 6.7 /100 | #236 | Tragic $44,552 |
| Immigrants | Ecuador | 5.9 /100 | #237 | Tragic $44,462 |
| Sudanese | 5.6 /100 | #238 | Tragic $44,419 |
| Senegalese | 5.3 /100 | #239 | Tragic $44,373 |
| Aleuts | 4.4 /100 | #240 | Tragic $44,241 |
| Samoans | 4.2 /100 | #241 | Tragic $44,206 |