Immigrants from Belize vs Immigrants from Scotland Median Earnings
COMPARE
Immigrants from Belize
Immigrants from Scotland
Median Earnings
Median Earnings Comparison
Immigrants from Belize
Immigrants from Scotland
$42,339
MEDIAN EARNINGS
0.3/ 100
METRIC RATING
275th/ 347
METRIC RANK
$50,741
MEDIAN EARNINGS
99.8/ 100
METRIC RATING
75th/ 347
METRIC RANK
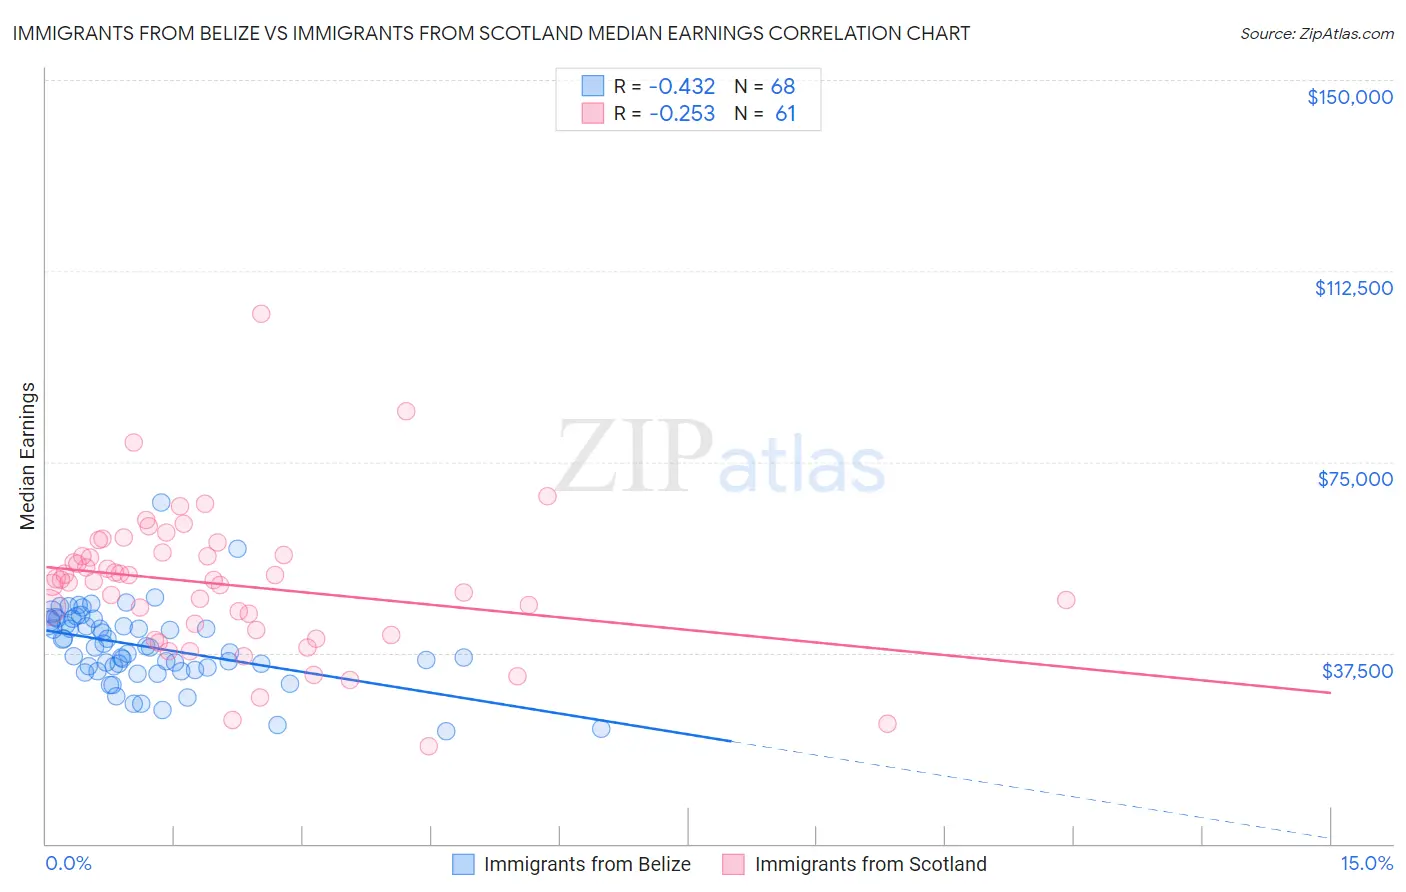
Immigrants from Belize vs Immigrants from Scotland Median Earnings Correlation Chart
The statistical analysis conducted on geographies consisting of 130,311,555 people shows a moderate negative correlation between the proportion of Immigrants from Belize and median earnings in the United States with a correlation coefficient (R) of -0.432 and weighted average of $42,339. Similarly, the statistical analysis conducted on geographies consisting of 196,389,390 people shows a weak negative correlation between the proportion of Immigrants from Scotland and median earnings in the United States with a correlation coefficient (R) of -0.253 and weighted average of $50,741, a difference of 19.8%.
Median Earnings Correlation Summary
| Measurement | Immigrants from Belize | Immigrants from Scotland |
| Minimum | $22,042 | $19,118 |
| Maximum | $66,975 | $104,015 |
| Range | $44,933 | $84,897 |
| Mean | $38,697 | $50,819 |
| Median | $38,598 | $51,683 |
| Interquartile 25% (IQ1) | $34,404 | $41,420 |
| Interquartile 75% (IQ3) | $43,711 | $56,954 |
| Interquartile Range (IQR) | $9,306 | $15,534 |
| Standard Deviation (Sample) | $7,646 | $14,157 |
| Standard Deviation (Population) | $7,590 | $14,040 |
Similar Demographics by Median Earnings
Demographics Similar to Immigrants from Belize by Median Earnings
In terms of median earnings, the demographic groups most similar to Immigrants from Belize are Spanish American ($42,316, a difference of 0.060%), Central American ($42,280, a difference of 0.14%), Immigrants from El Salvador ($42,413, a difference of 0.18%), Immigrants from Dominica ($42,420, a difference of 0.19%), and Iroquois ($42,430, a difference of 0.22%).
| Demographics | Rating | Rank | Median Earnings |
| Americans | 0.6 /100 | #268 | Tragic $42,742 |
| Belizeans | 0.5 /100 | #269 | Tragic $42,702 |
| Osage | 0.5 /100 | #270 | Tragic $42,651 |
| Pennsylvania Germans | 0.5 /100 | #271 | Tragic $42,615 |
| Iroquois | 0.4 /100 | #272 | Tragic $42,430 |
| Immigrants | Dominica | 0.4 /100 | #273 | Tragic $42,420 |
| Immigrants | El Salvador | 0.4 /100 | #274 | Tragic $42,413 |
| Immigrants | Belize | 0.3 /100 | #275 | Tragic $42,339 |
| Spanish Americans | 0.3 /100 | #276 | Tragic $42,316 |
| Central Americans | 0.3 /100 | #277 | Tragic $42,280 |
| Cajuns | 0.3 /100 | #278 | Tragic $42,189 |
| Colville | 0.2 /100 | #279 | Tragic $42,151 |
| Hmong | 0.2 /100 | #280 | Tragic $42,111 |
| Marshallese | 0.2 /100 | #281 | Tragic $41,969 |
| Africans | 0.2 /100 | #282 | Tragic $41,955 |
Demographics Similar to Immigrants from Scotland by Median Earnings
In terms of median earnings, the demographic groups most similar to Immigrants from Scotland are South African ($50,752, a difference of 0.020%), Immigrants from Netherlands ($50,818, a difference of 0.15%), Immigrants from Egypt ($50,901, a difference of 0.32%), Immigrants from Italy ($50,581, a difference of 0.32%), and Immigrants from Western Europe ($50,549, a difference of 0.38%).
| Demographics | Rating | Rank | Median Earnings |
| Paraguayans | 99.9 /100 | #68 | Exceptional $51,068 |
| Mongolians | 99.8 /100 | #69 | Exceptional $51,038 |
| Lithuanians | 99.8 /100 | #70 | Exceptional $50,991 |
| Immigrants | Ukraine | 99.8 /100 | #71 | Exceptional $50,984 |
| Immigrants | Egypt | 99.8 /100 | #72 | Exceptional $50,901 |
| Immigrants | Netherlands | 99.8 /100 | #73 | Exceptional $50,818 |
| South Africans | 99.8 /100 | #74 | Exceptional $50,752 |
| Immigrants | Scotland | 99.8 /100 | #75 | Exceptional $50,741 |
| Immigrants | Italy | 99.7 /100 | #76 | Exceptional $50,581 |
| Immigrants | Western Europe | 99.7 /100 | #77 | Exceptional $50,549 |
| Argentineans | 99.6 /100 | #78 | Exceptional $50,399 |
| Laotians | 99.6 /100 | #79 | Exceptional $50,343 |
| Ukrainians | 99.6 /100 | #80 | Exceptional $50,320 |
| Immigrants | Southern Europe | 99.6 /100 | #81 | Exceptional $50,280 |
| Immigrants | Moldova | 99.5 /100 | #82 | Exceptional $50,274 |