Immigrants from Belize vs Immigrants from Sri Lanka Median Earnings
COMPARE
Immigrants from Belize
Immigrants from Sri Lanka
Median Earnings
Median Earnings Comparison
Immigrants from Belize
Immigrants from Sri Lanka
$42,339
MEDIAN EARNINGS
0.3/ 100
METRIC RATING
275th/ 347
METRIC RANK
$53,268
MEDIAN EARNINGS
100.0/ 100
METRIC RATING
34th/ 347
METRIC RANK
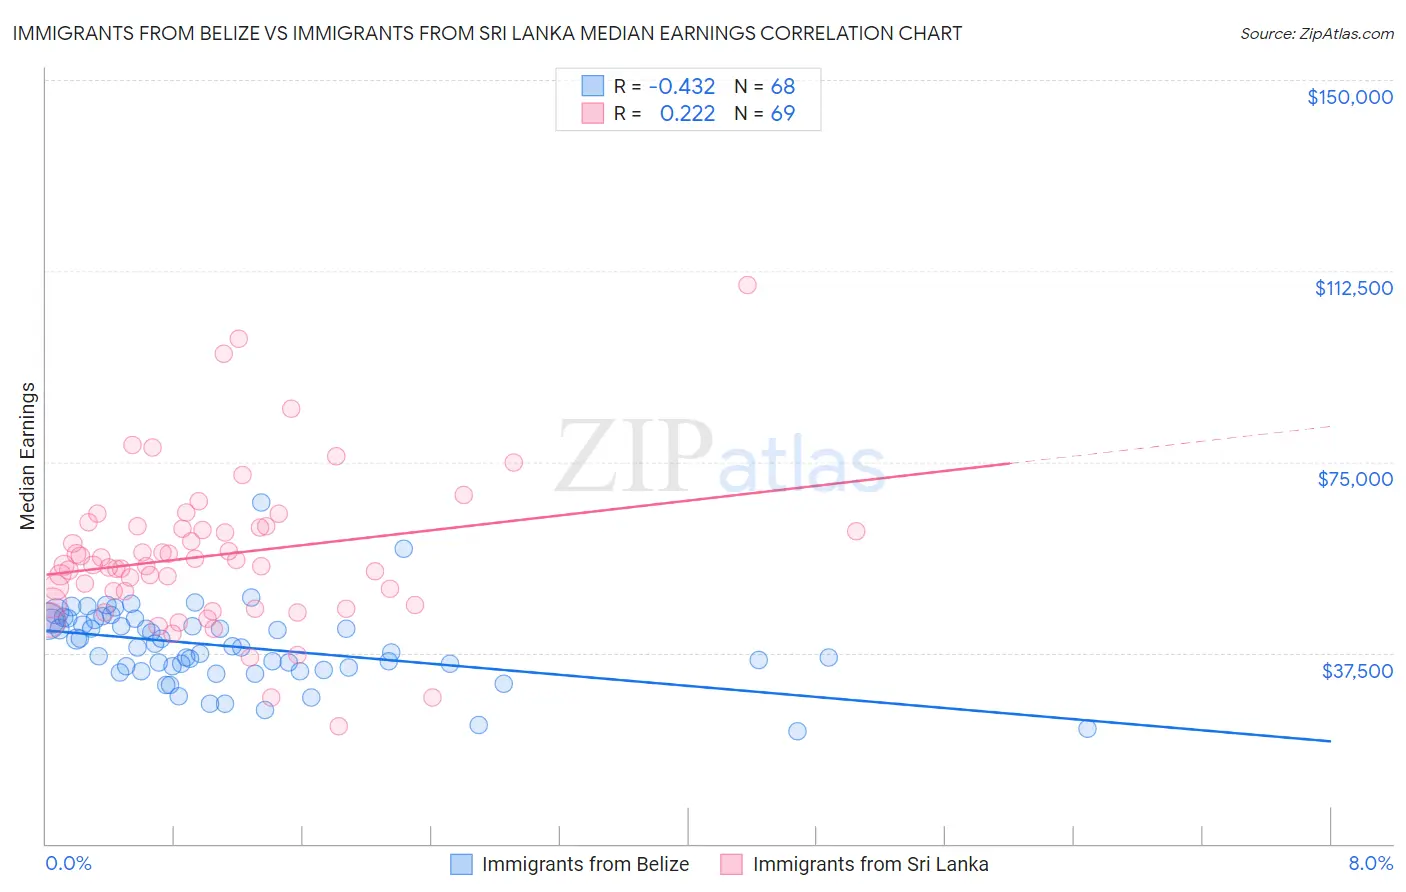
Immigrants from Belize vs Immigrants from Sri Lanka Median Earnings Correlation Chart
The statistical analysis conducted on geographies consisting of 130,311,555 people shows a moderate negative correlation between the proportion of Immigrants from Belize and median earnings in the United States with a correlation coefficient (R) of -0.432 and weighted average of $42,339. Similarly, the statistical analysis conducted on geographies consisting of 149,698,351 people shows a weak positive correlation between the proportion of Immigrants from Sri Lanka and median earnings in the United States with a correlation coefficient (R) of 0.222 and weighted average of $53,268, a difference of 25.8%.
Median Earnings Correlation Summary
| Measurement | Immigrants from Belize | Immigrants from Sri Lanka |
| Minimum | $22,042 | $23,025 |
| Maximum | $66,975 | $109,620 |
| Range | $44,933 | $86,595 |
| Mean | $38,697 | $56,667 |
| Median | $38,598 | $54,686 |
| Interquartile 25% (IQ1) | $34,404 | $47,118 |
| Interquartile 75% (IQ3) | $43,711 | $62,136 |
| Interquartile Range (IQR) | $9,306 | $15,018 |
| Standard Deviation (Sample) | $7,646 | $15,005 |
| Standard Deviation (Population) | $7,590 | $14,895 |
Similar Demographics by Median Earnings
Demographics Similar to Immigrants from Belize by Median Earnings
In terms of median earnings, the demographic groups most similar to Immigrants from Belize are Spanish American ($42,316, a difference of 0.060%), Central American ($42,280, a difference of 0.14%), Immigrants from El Salvador ($42,413, a difference of 0.18%), Immigrants from Dominica ($42,420, a difference of 0.19%), and Iroquois ($42,430, a difference of 0.22%).
| Demographics | Rating | Rank | Median Earnings |
| Americans | 0.6 /100 | #268 | Tragic $42,742 |
| Belizeans | 0.5 /100 | #269 | Tragic $42,702 |
| Osage | 0.5 /100 | #270 | Tragic $42,651 |
| Pennsylvania Germans | 0.5 /100 | #271 | Tragic $42,615 |
| Iroquois | 0.4 /100 | #272 | Tragic $42,430 |
| Immigrants | Dominica | 0.4 /100 | #273 | Tragic $42,420 |
| Immigrants | El Salvador | 0.4 /100 | #274 | Tragic $42,413 |
| Immigrants | Belize | 0.3 /100 | #275 | Tragic $42,339 |
| Spanish Americans | 0.3 /100 | #276 | Tragic $42,316 |
| Central Americans | 0.3 /100 | #277 | Tragic $42,280 |
| Cajuns | 0.3 /100 | #278 | Tragic $42,189 |
| Colville | 0.2 /100 | #279 | Tragic $42,151 |
| Hmong | 0.2 /100 | #280 | Tragic $42,111 |
| Marshallese | 0.2 /100 | #281 | Tragic $41,969 |
| Africans | 0.2 /100 | #282 | Tragic $41,955 |
Demographics Similar to Immigrants from Sri Lanka by Median Earnings
In terms of median earnings, the demographic groups most similar to Immigrants from Sri Lanka are Immigrants from Greece ($53,282, a difference of 0.030%), Immigrants from Asia ($53,310, a difference of 0.080%), Immigrants from Switzerland ($53,211, a difference of 0.11%), Russian ($53,334, a difference of 0.12%), and Immigrants from Denmark ($53,186, a difference of 0.15%).
| Demographics | Rating | Rank | Median Earnings |
| Asians | 100.0 /100 | #27 | Exceptional $53,690 |
| Immigrants | France | 100.0 /100 | #28 | Exceptional $53,490 |
| Immigrants | Russia | 100.0 /100 | #29 | Exceptional $53,457 |
| Cambodians | 100.0 /100 | #30 | Exceptional $53,386 |
| Russians | 100.0 /100 | #31 | Exceptional $53,334 |
| Immigrants | Asia | 100.0 /100 | #32 | Exceptional $53,310 |
| Immigrants | Greece | 100.0 /100 | #33 | Exceptional $53,282 |
| Immigrants | Sri Lanka | 100.0 /100 | #34 | Exceptional $53,268 |
| Immigrants | Switzerland | 100.0 /100 | #35 | Exceptional $53,211 |
| Immigrants | Denmark | 100.0 /100 | #36 | Exceptional $53,186 |
| Immigrants | Belarus | 100.0 /100 | #37 | Exceptional $53,043 |
| Latvians | 100.0 /100 | #38 | Exceptional $53,001 |
| Immigrants | Turkey | 100.0 /100 | #39 | Exceptional $52,960 |
| Israelis | 100.0 /100 | #40 | Exceptional $52,937 |
| Immigrants | Lithuania | 100.0 /100 | #41 | Exceptional $52,769 |