Immigrants from Belize vs Immigrants from Iran Unemployment Among Ages 55 to 59 years
COMPARE
Immigrants from Belize
Immigrants from Iran
Unemployment Among Ages 55 to 59 years
Unemployment Among Ages 55 to 59 years Comparison
Immigrants from Belize
Immigrants from Iran
5.5%
UNEMPLOYMENT AMONG AGES 55 TO 59 YEARS
0.0/ 100
METRIC RATING
307th/ 347
METRIC RANK
5.0%
UNEMPLOYMENT AMONG AGES 55 TO 59 YEARS
3.7/ 100
METRIC RATING
227th/ 347
METRIC RANK
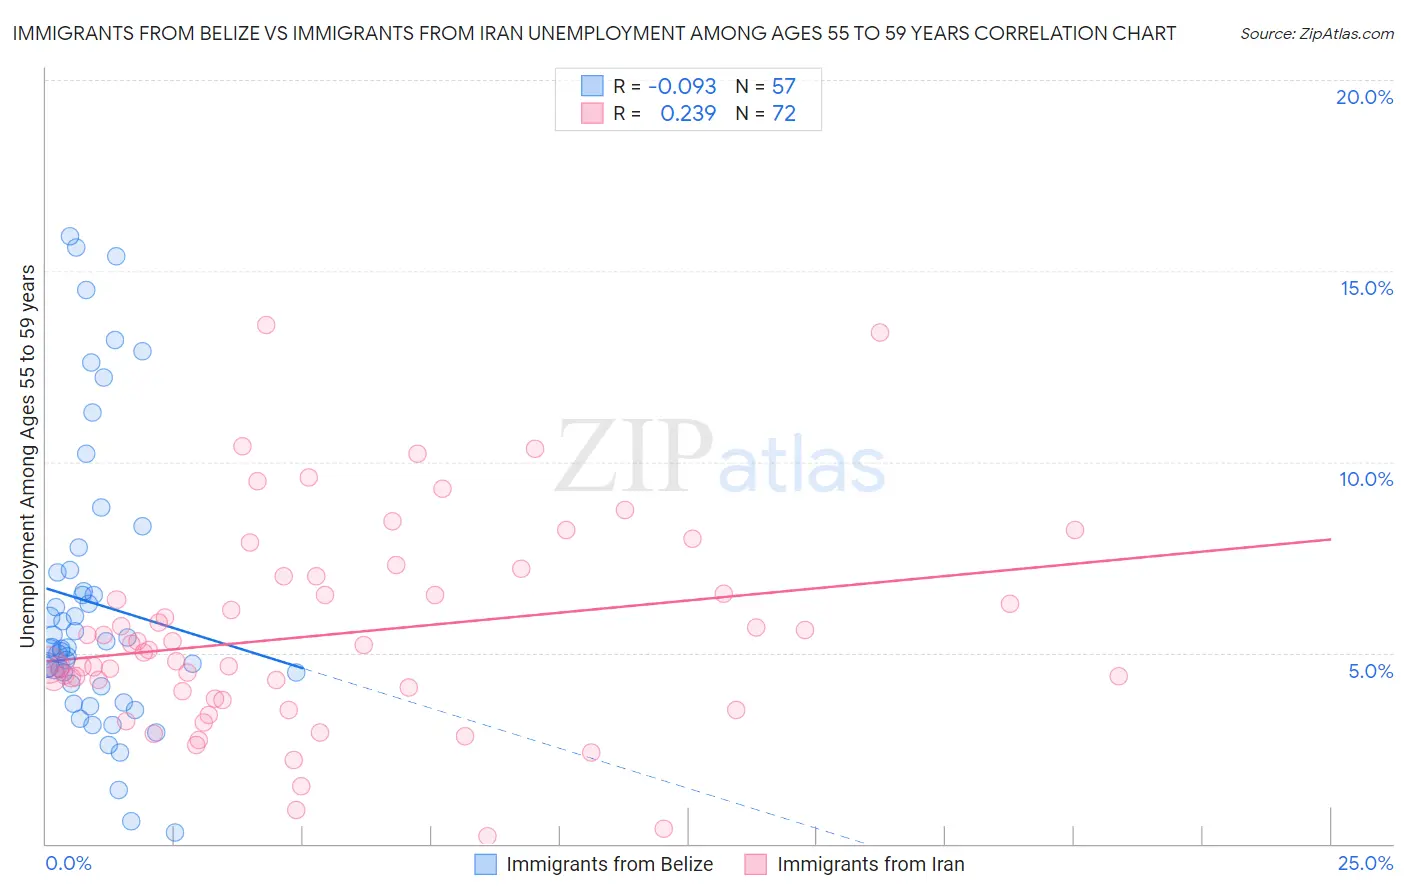
Immigrants from Belize vs Immigrants from Iran Unemployment Among Ages 55 to 59 years Correlation Chart
The statistical analysis conducted on geographies consisting of 127,651,954 people shows a slight negative correlation between the proportion of Immigrants from Belize and unemployment rate among population between the ages 55 and 59 in the United States with a correlation coefficient (R) of -0.093 and weighted average of 5.5%. Similarly, the statistical analysis conducted on geographies consisting of 268,472,905 people shows a weak positive correlation between the proportion of Immigrants from Iran and unemployment rate among population between the ages 55 and 59 in the United States with a correlation coefficient (R) of 0.239 and weighted average of 5.0%, a difference of 11.0%.
Unemployment Among Ages 55 to 59 years Correlation Summary
| Measurement | Immigrants from Belize | Immigrants from Iran |
| Minimum | 0.30% | 0.20% |
| Maximum | 15.9% | 13.6% |
| Range | 15.6% | 13.4% |
| Mean | 6.3% | 5.5% |
| Median | 5.1% | 5.0% |
| Interquartile 25% (IQ1) | 4.2% | 3.9% |
| Interquartile 75% (IQ3) | 7.1% | 6.8% |
| Interquartile Range (IQR) | 3.0% | 2.9% |
| Standard Deviation (Sample) | 3.7% | 2.7% |
| Standard Deviation (Population) | 3.7% | 2.6% |
Similar Demographics by Unemployment Among Ages 55 to 59 years
Demographics Similar to Immigrants from Belize by Unemployment Among Ages 55 to 59 years
In terms of unemployment among ages 55 to 59 years, the demographic groups most similar to Immigrants from Belize are Immigrants from Cabo Verde (5.5%, a difference of 0.22%), Immigrants from Portugal (5.5%, a difference of 0.34%), Spanish American Indian (5.6%, a difference of 0.50%), Black/African American (5.5%, a difference of 0.51%), and Sierra Leonean (5.5%, a difference of 1.0%).
| Demographics | Rating | Rank | Unemployment Among Ages 55 to 59 years |
| Immigrants | St. Vincent and the Grenadines | 0.0 /100 | #300 | Tragic 5.4% |
| Immigrants | Dominica | 0.0 /100 | #301 | Tragic 5.5% |
| Sierra Leoneans | 0.0 /100 | #302 | Tragic 5.5% |
| Marshallese | 0.0 /100 | #303 | Tragic 5.5% |
| Blacks/African Americans | 0.0 /100 | #304 | Tragic 5.5% |
| Immigrants | Portugal | 0.0 /100 | #305 | Tragic 5.5% |
| Immigrants | Cabo Verde | 0.0 /100 | #306 | Tragic 5.5% |
| Immigrants | Belize | 0.0 /100 | #307 | Tragic 5.5% |
| Spanish American Indians | 0.0 /100 | #308 | Tragic 5.6% |
| Nepalese | 0.0 /100 | #309 | Tragic 5.6% |
| Belizeans | 0.0 /100 | #310 | Tragic 5.6% |
| Houma | 0.0 /100 | #311 | Tragic 5.6% |
| Ecuadorians | 0.0 /100 | #312 | Tragic 5.6% |
| Central American Indians | 0.0 /100 | #313 | Tragic 5.6% |
| Tlingit-Haida | 0.0 /100 | #314 | Tragic 5.7% |
Demographics Similar to Immigrants from Iran by Unemployment Among Ages 55 to 59 years
In terms of unemployment among ages 55 to 59 years, the demographic groups most similar to Immigrants from Iran are Immigrants from China (5.0%, a difference of 0.13%), Immigrants from Liberia (5.0%, a difference of 0.13%), Costa Rican (5.0%, a difference of 0.18%), Subsaharan African (5.0%, a difference of 0.19%), and Immigrants from Western Asia (5.0%, a difference of 0.21%).
| Demographics | Rating | Rank | Unemployment Among Ages 55 to 59 years |
| Indians (Asian) | 7.6 /100 | #220 | Tragic 4.9% |
| Nigerians | 7.5 /100 | #221 | Tragic 4.9% |
| Spanish | 5.1 /100 | #222 | Tragic 5.0% |
| Immigrants | Ireland | 4.8 /100 | #223 | Tragic 5.0% |
| Sub-Saharan Africans | 4.4 /100 | #224 | Tragic 5.0% |
| Costa Ricans | 4.4 /100 | #225 | Tragic 5.0% |
| Immigrants | China | 4.2 /100 | #226 | Tragic 5.0% |
| Immigrants | Iran | 3.7 /100 | #227 | Tragic 5.0% |
| Immigrants | Liberia | 3.2 /100 | #228 | Tragic 5.0% |
| Immigrants | Western Asia | 3.0 /100 | #229 | Tragic 5.0% |
| Immigrants | Syria | 2.7 /100 | #230 | Tragic 5.0% |
| Cherokee | 2.6 /100 | #231 | Tragic 5.0% |
| Albanians | 2.5 /100 | #232 | Tragic 5.0% |
| Immigrants | Immigrants | 2.3 /100 | #233 | Tragic 5.0% |
| Immigrants | Southern Europe | 1.8 /100 | #234 | Tragic 5.0% |