Immigrants from the Azores vs Dutch Median Earnings
COMPARE
Immigrants from the Azores
Dutch
Median Earnings
Median Earnings Comparison
Immigrants from the Azores
Dutch
$45,812
MEDIAN EARNINGS
29.5/ 100
METRIC RATING
200th/ 347
METRIC RANK
$45,370
MEDIAN EARNINGS
18.4/ 100
METRIC RATING
219th/ 347
METRIC RANK
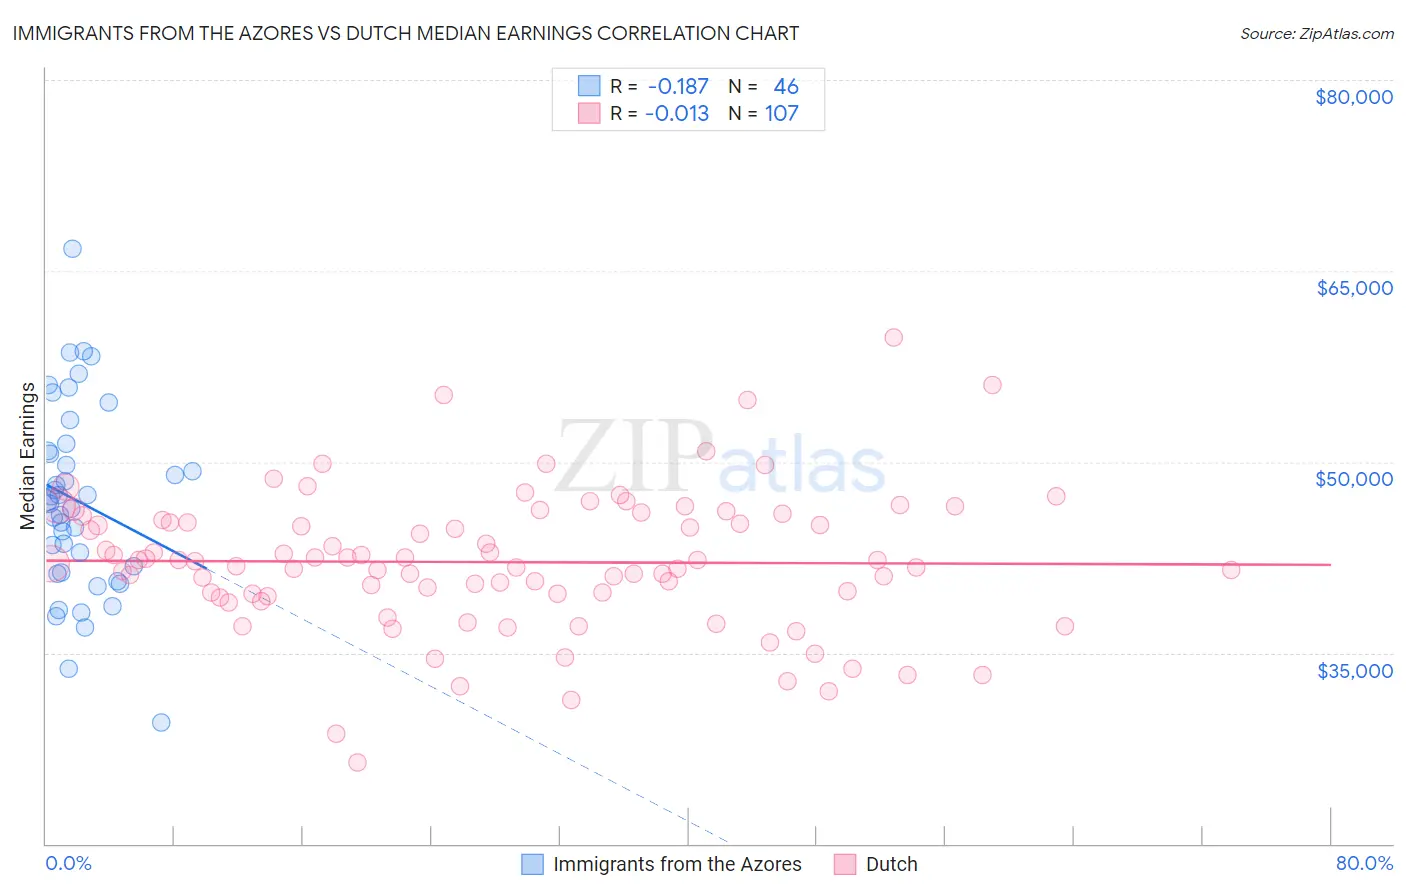
Immigrants from the Azores vs Dutch Median Earnings Correlation Chart
The statistical analysis conducted on geographies consisting of 46,253,253 people shows a poor negative correlation between the proportion of Immigrants from the Azores and median earnings in the United States with a correlation coefficient (R) of -0.187 and weighted average of $45,812. Similarly, the statistical analysis conducted on geographies consisting of 554,077,686 people shows no correlation between the proportion of Dutch and median earnings in the United States with a correlation coefficient (R) of -0.013 and weighted average of $45,370, a difference of 0.97%.
Median Earnings Correlation Summary
| Measurement | Immigrants from the Azores | Dutch |
| Minimum | $29,500 | $26,401 |
| Maximum | $66,731 | $59,776 |
| Range | $37,231 | $33,374 |
| Mean | $46,892 | $42,124 |
| Median | $46,853 | $42,201 |
| Interquartile 25% (IQ1) | $41,350 | $39,612 |
| Interquartile 75% (IQ3) | $50,852 | $45,450 |
| Interquartile Range (IQR) | $9,501 | $5,838 |
| Standard Deviation (Sample) | $7,383 | $5,476 |
| Standard Deviation (Population) | $7,302 | $5,450 |
Demographics Similar to Immigrants from the Azores and Dutch by Median Earnings
In terms of median earnings, the demographic groups most similar to Immigrants from the Azores are Immigrants from Barbados ($45,816, a difference of 0.010%), Celtic ($45,732, a difference of 0.18%), Immigrants from Trinidad and Tobago ($45,729, a difference of 0.18%), Welsh ($45,710, a difference of 0.22%), and Immigrants from Uruguay ($45,682, a difference of 0.28%). Similarly, the demographic groups most similar to Dutch are Spanish ($45,432, a difference of 0.14%), Guyanese ($45,470, a difference of 0.22%), Tlingit-Haida ($45,468, a difference of 0.22%), Nigerian ($45,532, a difference of 0.36%), and Immigrants from Bangladesh ($45,532, a difference of 0.36%).
| Demographics | Rating | Rank | Median Earnings |
| Immigrants | Barbados | 29.6 /100 | #199 | Fair $45,816 |
| Immigrants | Azores | 29.5 /100 | #200 | Fair $45,812 |
| Celtics | 27.2 /100 | #201 | Fair $45,732 |
| Immigrants | Trinidad and Tobago | 27.1 /100 | #202 | Fair $45,729 |
| Welsh | 26.6 /100 | #203 | Fair $45,710 |
| Immigrants | Uruguay | 25.9 /100 | #204 | Fair $45,682 |
| Tongans | 25.4 /100 | #205 | Fair $45,665 |
| Immigrants | Ghana | 24.8 /100 | #206 | Fair $45,641 |
| Immigrants | Senegal | 24.0 /100 | #207 | Fair $45,611 |
| Immigrants | Bosnia and Herzegovina | 23.7 /100 | #208 | Fair $45,600 |
| Immigrants | Thailand | 23.7 /100 | #209 | Fair $45,598 |
| Immigrants | Grenada | 23.6 /100 | #210 | Fair $45,596 |
| Panamanians | 23.5 /100 | #211 | Fair $45,593 |
| Bermudans | 23.5 /100 | #212 | Fair $45,593 |
| Immigrants | Colombia | 22.4 /100 | #213 | Fair $45,550 |
| Nigerians | 22.0 /100 | #214 | Fair $45,532 |
| Immigrants | Bangladesh | 22.0 /100 | #215 | Fair $45,532 |
| Guyanese | 20.6 /100 | #216 | Fair $45,470 |
| Tlingit-Haida | 20.5 /100 | #217 | Fair $45,468 |
| Spanish | 19.7 /100 | #218 | Poor $45,432 |
| Dutch | 18.4 /100 | #219 | Poor $45,370 |