Immigrants from Austria vs Immigrants from Thailand Wage/Income Gap
COMPARE
Immigrants from Austria
Immigrants from Thailand
Wage/Income Gap
Wage/Income Gap Comparison
Immigrants from Austria
Immigrants from Thailand
28.1%
WAGE/INCOME GAP
0.4/ 100
METRIC RATING
286th/ 347
METRIC RANK
24.5%
WAGE/INCOME GAP
94.9/ 100
METRIC RATING
121st/ 347
METRIC RANK
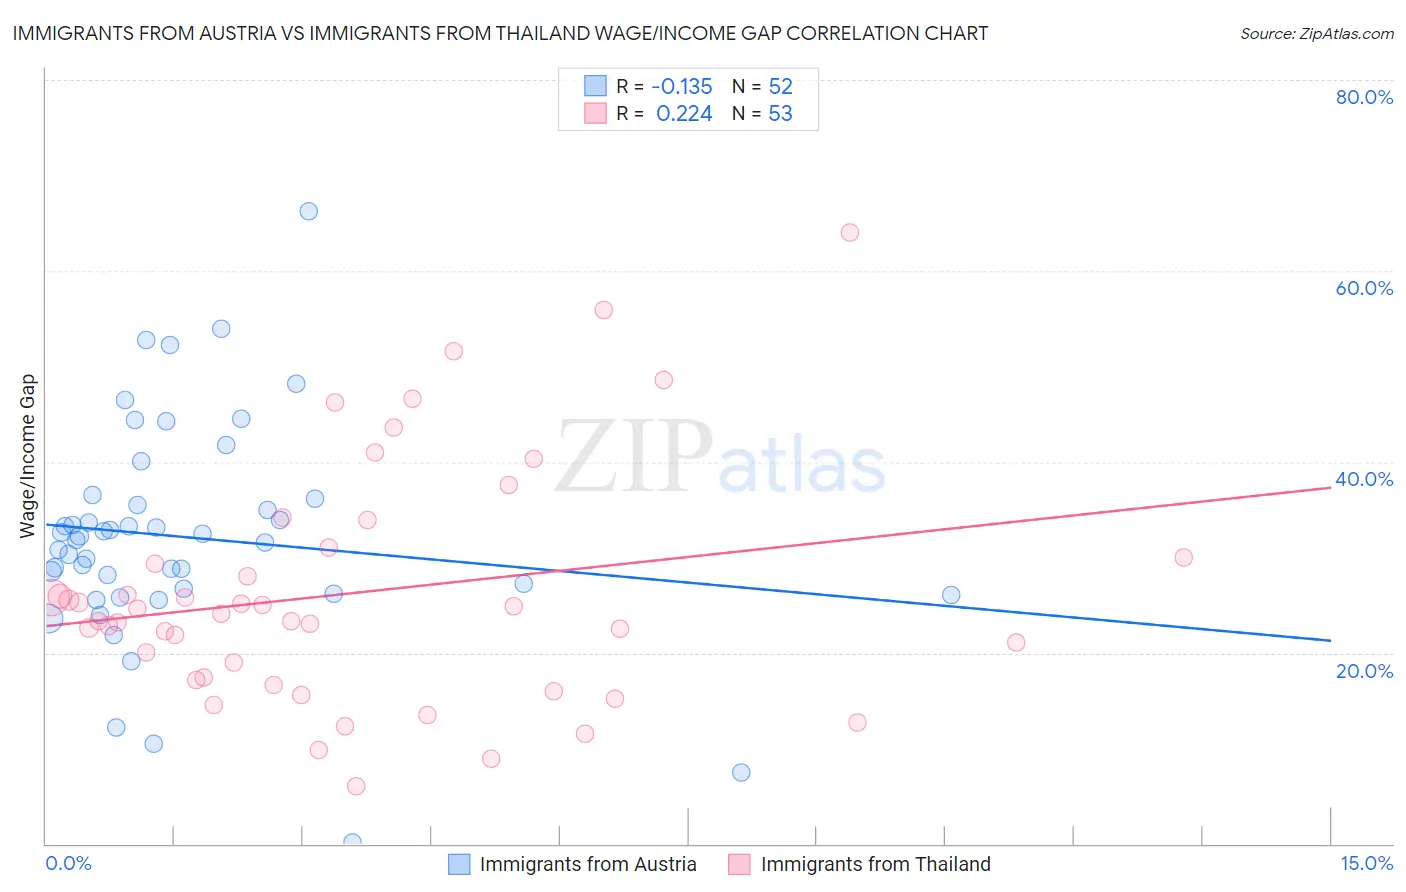
Immigrants from Austria vs Immigrants from Thailand Wage/Income Gap Correlation Chart
The statistical analysis conducted on geographies consisting of 167,902,173 people shows a poor negative correlation between the proportion of Immigrants from Austria and wage/income gap percentage in the United States with a correlation coefficient (R) of -0.135 and weighted average of 28.1%. Similarly, the statistical analysis conducted on geographies consisting of 316,913,718 people shows a weak positive correlation between the proportion of Immigrants from Thailand and wage/income gap percentage in the United States with a correlation coefficient (R) of 0.224 and weighted average of 24.5%, a difference of 14.6%.
Wage/Income Gap Correlation Summary
| Measurement | Immigrants from Austria | Immigrants from Thailand |
| Minimum | 0.18% | 6.1% |
| Maximum | 66.3% | 64.0% |
| Range | 66.1% | 57.9% |
| Mean | 32.1% | 26.3% |
| Median | 32.1% | 24.1% |
| Interquartile 25% (IQ1) | 26.4% | 17.3% |
| Interquartile 75% (IQ3) | 35.9% | 30.5% |
| Interquartile Range (IQR) | 9.4% | 13.2% |
| Standard Deviation (Sample) | 11.6% | 12.4% |
| Standard Deviation (Population) | 11.5% | 12.3% |
Similar Demographics by Wage/Income Gap
Demographics Similar to Immigrants from Austria by Wage/Income Gap
In terms of wage/income gap, the demographic groups most similar to Immigrants from Austria are Italian (28.1%, a difference of 0.030%), Okinawan (28.1%, a difference of 0.040%), Choctaw (28.1%, a difference of 0.070%), Canadian (28.1%, a difference of 0.11%), and Immigrants from Sweden (28.1%, a difference of 0.16%).
| Demographics | Rating | Rank | Wage/Income Gap |
| Romanians | 0.5 /100 | #279 | Tragic 28.0% |
| Russians | 0.5 /100 | #280 | Tragic 28.0% |
| Burmese | 0.5 /100 | #281 | Tragic 28.0% |
| South Africans | 0.5 /100 | #282 | Tragic 28.0% |
| French Canadians | 0.4 /100 | #283 | Tragic 28.1% |
| Immigrants | Sweden | 0.4 /100 | #284 | Tragic 28.1% |
| Italians | 0.4 /100 | #285 | Tragic 28.1% |
| Immigrants | Austria | 0.4 /100 | #286 | Tragic 28.1% |
| Okinawans | 0.4 /100 | #287 | Tragic 28.1% |
| Choctaw | 0.4 /100 | #288 | Tragic 28.1% |
| Canadians | 0.3 /100 | #289 | Tragic 28.1% |
| Australians | 0.3 /100 | #290 | Tragic 28.2% |
| Czechoslovakians | 0.3 /100 | #291 | Tragic 28.2% |
| Immigrants | Australia | 0.3 /100 | #292 | Tragic 28.2% |
| Immigrants | Israel | 0.3 /100 | #293 | Tragic 28.2% |
Demographics Similar to Immigrants from Thailand by Wage/Income Gap
In terms of wage/income gap, the demographic groups most similar to Immigrants from Thailand are Apache (24.5%, a difference of 0.050%), Native/Alaskan (24.6%, a difference of 0.12%), Cree (24.5%, a difference of 0.27%), Immigrants from South America (24.6%, a difference of 0.33%), and Kenyan (24.5%, a difference of 0.34%).
| Demographics | Rating | Rank | Wage/Income Gap |
| Panamanians | 96.5 /100 | #114 | Exceptional 24.4% |
| Immigrants | Kenya | 96.4 /100 | #115 | Exceptional 24.4% |
| Alaska Natives | 96.0 /100 | #116 | Exceptional 24.4% |
| Immigrants | Afghanistan | 95.9 /100 | #117 | Exceptional 24.4% |
| Immigrants | Micronesia | 95.8 /100 | #118 | Exceptional 24.4% |
| Kenyans | 95.8 /100 | #119 | Exceptional 24.5% |
| Cree | 95.6 /100 | #120 | Exceptional 24.5% |
| Immigrants | Thailand | 94.9 /100 | #121 | Exceptional 24.5% |
| Apache | 94.8 /100 | #122 | Exceptional 24.5% |
| Natives/Alaskans | 94.6 /100 | #123 | Exceptional 24.6% |
| Immigrants | South America | 93.9 /100 | #124 | Exceptional 24.6% |
| Spanish Americans | 93.8 /100 | #125 | Exceptional 24.6% |
| Immigrants | Uruguay | 93.8 /100 | #126 | Exceptional 24.6% |
| German Russians | 93.7 /100 | #127 | Exceptional 24.6% |
| Immigrants | Central America | 93.5 /100 | #128 | Exceptional 24.6% |