Immigrants from India vs Immigrants from Somalia Per Capita Income
COMPARE
Immigrants from India
Immigrants from Somalia
Per Capita Income
Per Capita Income Comparison
Immigrants from India
Immigrants from Somalia
$55,268
PER CAPITA INCOME
100.0/ 100
METRIC RATING
13th/ 347
METRIC RANK
$39,974
PER CAPITA INCOME
1.6/ 100
METRIC RATING
247th/ 347
METRIC RANK
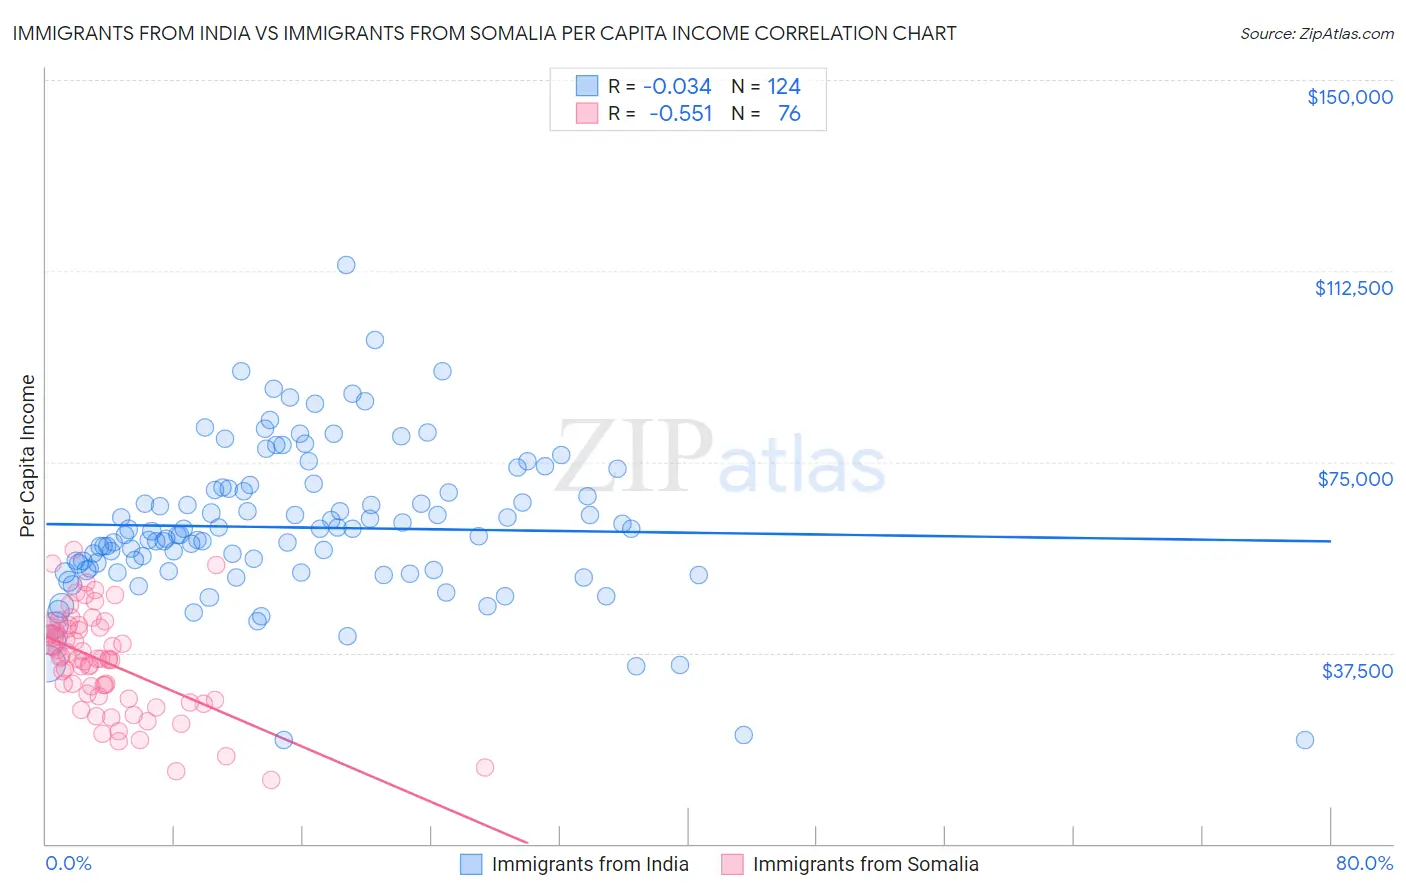
Immigrants from India vs Immigrants from Somalia Per Capita Income Correlation Chart
The statistical analysis conducted on geographies consisting of 434,146,004 people shows no correlation between the proportion of Immigrants from India and per capita income in the United States with a correlation coefficient (R) of -0.034 and weighted average of $55,268. Similarly, the statistical analysis conducted on geographies consisting of 92,111,755 people shows a substantial negative correlation between the proportion of Immigrants from Somalia and per capita income in the United States with a correlation coefficient (R) of -0.551 and weighted average of $39,974, a difference of 38.3%.
Per Capita Income Correlation Summary
| Measurement | Immigrants from India | Immigrants from Somalia |
| Minimum | $20,341 | $12,576 |
| Maximum | $113,550 | $57,592 |
| Range | $93,209 | $45,016 |
| Mean | $62,129 | $35,739 |
| Median | $60,635 | $36,374 |
| Interquartile 25% (IQ1) | $53,591 | $28,746 |
| Interquartile 75% (IQ3) | $69,609 | $42,371 |
| Interquartile Range (IQR) | $16,018 | $13,624 |
| Standard Deviation (Sample) | $14,973 | $9,785 |
| Standard Deviation (Population) | $14,913 | $9,721 |
Similar Demographics by Per Capita Income
Demographics Similar to Immigrants from India by Per Capita Income
In terms of per capita income, the demographic groups most similar to Immigrants from India are Immigrants from Belgium ($55,082, a difference of 0.34%), Immigrants from Sweden ($55,582, a difference of 0.57%), Cypriot ($54,899, a difference of 0.67%), Immigrants from Switzerland ($54,866, a difference of 0.73%), and Eastern European ($55,780, a difference of 0.93%).
| Demographics | Rating | Rank | Per Capita Income |
| Immigrants | Taiwan | 100.0 /100 | #6 | Exceptional $57,742 |
| Immigrants | Israel | 100.0 /100 | #7 | Exceptional $57,384 |
| Immigrants | Hong Kong | 100.0 /100 | #8 | Exceptional $56,709 |
| Immigrants | Ireland | 100.0 /100 | #9 | Exceptional $56,584 |
| Okinawans | 100.0 /100 | #10 | Exceptional $55,817 |
| Eastern Europeans | 100.0 /100 | #11 | Exceptional $55,780 |
| Immigrants | Sweden | 100.0 /100 | #12 | Exceptional $55,582 |
| Immigrants | India | 100.0 /100 | #13 | Exceptional $55,268 |
| Immigrants | Belgium | 100.0 /100 | #14 | Exceptional $55,082 |
| Cypriots | 100.0 /100 | #15 | Exceptional $54,899 |
| Immigrants | Switzerland | 100.0 /100 | #16 | Exceptional $54,866 |
| Immigrants | France | 100.0 /100 | #17 | Exceptional $54,557 |
| Thais | 100.0 /100 | #18 | Exceptional $54,307 |
| Immigrants | China | 100.0 /100 | #19 | Exceptional $54,264 |
| Soviet Union | 100.0 /100 | #20 | Exceptional $54,202 |
Demographics Similar to Immigrants from Somalia by Per Capita Income
In terms of per capita income, the demographic groups most similar to Immigrants from Somalia are Cape Verdean ($39,935, a difference of 0.10%), Cree ($40,056, a difference of 0.20%), Japanese ($39,870, a difference of 0.26%), Immigrants from Burma/Myanmar ($39,827, a difference of 0.37%), and Samoan ($39,826, a difference of 0.37%).
| Demographics | Rating | Rank | Per Capita Income |
| Immigrants | Nigeria | 2.3 /100 | #240 | Tragic $40,339 |
| British West Indians | 2.3 /100 | #241 | Tragic $40,330 |
| Immigrants | Western Africa | 2.2 /100 | #242 | Tragic $40,294 |
| German Russians | 2.2 /100 | #243 | Tragic $40,266 |
| French American Indians | 2.1 /100 | #244 | Tragic $40,244 |
| Sub-Saharan Africans | 1.9 /100 | #245 | Tragic $40,152 |
| Cree | 1.7 /100 | #246 | Tragic $40,056 |
| Immigrants | Somalia | 1.6 /100 | #247 | Tragic $39,974 |
| Cape Verdeans | 1.5 /100 | #248 | Tragic $39,935 |
| Japanese | 1.4 /100 | #249 | Tragic $39,870 |
| Immigrants | Burma/Myanmar | 1.3 /100 | #250 | Tragic $39,827 |
| Samoans | 1.3 /100 | #251 | Tragic $39,826 |
| Immigrants | Azores | 1.0 /100 | #252 | Tragic $39,608 |
| Osage | 1.0 /100 | #253 | Tragic $39,568 |
| Alaska Natives | 1.0 /100 | #254 | Tragic $39,558 |