Hungarian vs Trinidadian and Tobagonian Median Female Earnings

COMPARE

Hungarian
Race
Ancestry
AfghanAfricanAlaska NativeAlaskan AthabascanAlbanianAleutAlsatianAmericanApacheArabArapahoArgentineanArmenianAssyrian/Chaldean/SyriacAustralianAustrianBahamianBangladeshiBarbadianBasqueBelgianBelizeanBermudanBhutaneseBlackfeetBolivianBrazilianBritishBritish West IndianBulgarianBurmeseCajunCambodianCanadianCape VerdeanCarpatho RusynCelticCentral AmericanCentral American IndianCherokeeCheyenneChickasawChileanChineseChippewaChoctawColombianColvilleComancheCosta RicanCreeCreekCroatianCrowCubanCypriotCzechCzechoslovakianDanishDelawareDominicanDutchDutch West IndianEastern EuropeanEcuadorianEgyptianEnglishEstonianEthiopianEuropeanFijianFilipinoFinnishFrenchFrench American IndianFrench CanadianGermanGerman RussianGhanaianGreekGuamanian/ChamorroGuatemalanGuyaneseHaitianHmongHonduranHopiHoumaHungarianIcelanderIndian (Asian)IndonesianInupiatIranianIraqiIrishIroquoisIsraeliItalianJamaicanJapaneseJordanianKenyanKiowaKoreanLaotianLatvianLebaneseLiberianLithuanianLumbeeLuxembourgerMacedonianMalaysianMalteseMarshalleseMenomineeMexicanMexican American IndianMongolianMoroccanNative HawaiianNavajoNepaleseNew ZealanderNicaraguanNigerianNorthern EuropeanNorwegianOkinawanOsageOttawaPaiutePakistaniPalestinianPanamanianParaguayanPennsylvania GermanPeruvianPimaPolishPortuguesePotawatomiPuebloPuerto RicanPuget Sound SalishRomanianRussianSalvadoranSamoanScandinavianScotch-IrishScottishSeminoleSenegaleseSerbianShoshoneSierra LeoneanSiouxSlavicSlovakSloveneSomaliSouth AfricanSouth AmericanSouth American IndianSoviet UnionSpaniardSpanishSpanish AmericanSpanish American IndianSri LankanSubsaharan AfricanSudaneseSwedishSwissSyrianTaiwaneseThaiTlingit-HaidaTohono O'OdhamTonganTsimshianTurkishU.S. Virgin IslanderUgandanUkrainianUruguayanUteVenezuelanVietnameseWelshWest IndianYakamaYaquiYugoslavianYumanYup'ikZimbabwean
Immigration
NonimmigrantsImmigrantsAfghanistanAfricaAlbaniaArgentinaArmeniaAsiaAustraliaAustriaBahamasBangladeshBarbadosBelarusBelgiumBelizeBoliviaBosnia and HerzegovinaBrazilBulgariaBurma/MyanmarCabo VerdeCambodiaCameroonCanadaCaribbeanCentral AmericaChileChinaColombiaCongoCosta RicaCroatiaCubaCzechoslovakiaDenmarkDominicaDominican RepublicEastern AfricaEastern AsiaEastern EuropeEcuadorEgyptEl SalvadorEnglandEritreaEthiopiaEuropeFijiFranceGermanyGhanaGreeceGrenadaGuatemalaGuyanaHaitiHondurasHong KongHungaryIndiaIndonesiaIranIraqIrelandIsraelItalyJamaicaJapanJordanKazakhstanKenyaKoreaKuwaitLaosLatin AmericaLatviaLebanonLiberiaLithuaniaMalaysiaMexicoMicronesiaMiddle AfricaMoldovaMoroccoNepalNetherlandsNicaraguaNigeriaNorth AmericaNorth MacedoniaNorthern AfricaNorthern EuropeNorwayOceaniaPakistanPanamaPeruPhilippinesPolandPortugalRomaniaRussiaSaudi ArabiaScotlandSenegalSerbiaSierra LeoneSingaporeSomaliaSouth AfricaSouth AmericaSouth Central AsiaSouth Eastern AsiaSouthern EuropeSpainSri LankaSt. Vincent and the GrenadinesSudanSwedenSwitzerlandSyriaTaiwanThailandTrinidad and TobagoTurkeyUgandaUkraineUruguayUzbekistanVenezuelaVietnamWest IndiesWestern AfricaWestern AsiaWestern EuropeYemenZaireZimbabweAzores
Trinidadian and Tobagonian
Race
Ancestry
AfghanAfricanAlaska NativeAlaskan AthabascanAlbanianAleutAlsatianAmericanApacheArabArapahoArgentineanArmenianAssyrian/Chaldean/SyriacAustralianAustrianBahamianBangladeshiBarbadianBasqueBelgianBelizeanBermudanBhutaneseBlackfeetBolivianBrazilianBritishBritish West IndianBulgarianBurmeseCajunCambodianCanadianCape VerdeanCarpatho RusynCelticCentral AmericanCentral American IndianCherokeeCheyenneChickasawChileanChineseChippewaChoctawColombianColvilleComancheCosta RicanCreeCreekCroatianCrowCubanCypriotCzechCzechoslovakianDanishDelawareDominicanDutchDutch West IndianEastern EuropeanEcuadorianEgyptianEnglishEstonianEthiopianEuropeanFijianFilipinoFinnishFrenchFrench American IndianFrench CanadianGermanGerman RussianGhanaianGreekGuamanian/ChamorroGuatemalanGuyaneseHaitianHmongHonduranHopiHoumaIcelanderIndian (Asian)IndonesianInupiatIranianIraqiIrishIroquoisIsraeliItalianJamaicanJapaneseJordanianKenyanKiowaKoreanLaotianLatvianLebaneseLiberianLithuanianLumbeeLuxembourgerMacedonianMalaysianMalteseMarshalleseMenomineeMexicanMexican American IndianMongolianMoroccanNative HawaiianNavajoNepaleseNew ZealanderNicaraguanNigerianNorthern EuropeanNorwegianOkinawanOsageOttawaPaiutePakistaniPalestinianPanamanianParaguayanPennsylvania GermanPeruvianPimaPolishPortuguesePotawatomiPuebloPuerto RicanPuget Sound SalishRomanianRussianSalvadoranSamoanScandinavianScotch-IrishScottishSeminoleSenegaleseSerbianShoshoneSierra LeoneanSiouxSlavicSlovakSloveneSomaliSouth AfricanSouth AmericanSouth American IndianSoviet UnionSpaniardSpanishSpanish AmericanSpanish American IndianSri LankanSubsaharan AfricanSudaneseSwedishSwissSyrianTaiwaneseThaiTlingit-HaidaTohono O'OdhamTonganTrinidadian and TobagonianTsimshianTurkishU.S. Virgin IslanderUgandanUkrainianUruguayanUteVenezuelanVietnameseWelshWest IndianYakamaYaquiYugoslavianYumanYup'ikZimbabwean
Immigration
NonimmigrantsImmigrantsAfghanistanAfricaAlbaniaArgentinaArmeniaAsiaAustraliaAustriaBahamasBangladeshBarbadosBelarusBelgiumBelizeBoliviaBosnia and HerzegovinaBrazilBulgariaBurma/MyanmarCabo VerdeCambodiaCameroonCanadaCaribbeanCentral AmericaChileChinaColombiaCongoCosta RicaCroatiaCubaCzechoslovakiaDenmarkDominicaDominican RepublicEastern AfricaEastern AsiaEastern EuropeEcuadorEgyptEl SalvadorEnglandEritreaEthiopiaEuropeFijiFranceGermanyGhanaGreeceGrenadaGuatemalaGuyanaHaitiHondurasHong KongHungaryIndiaIndonesiaIranIraqIrelandIsraelItalyJamaicaJapanJordanKazakhstanKenyaKoreaKuwaitLaosLatin AmericaLatviaLebanonLiberiaLithuaniaMalaysiaMexicoMicronesiaMiddle AfricaMoldovaMoroccoNepalNetherlandsNicaraguaNigeriaNorth AmericaNorth MacedoniaNorthern AfricaNorthern EuropeNorwayOceaniaPakistanPanamaPeruPhilippinesPolandPortugalRomaniaRussiaSaudi ArabiaScotlandSenegalSerbiaSierra LeoneSingaporeSomaliaSouth AfricaSouth AmericaSouth Central AsiaSouth Eastern AsiaSouthern EuropeSpainSri LankaSt. Vincent and the GrenadinesSudanSwedenSwitzerlandSyriaTaiwanThailandTrinidad and TobagoTurkeyUgandaUkraineUruguayUzbekistanVenezuelaVietnamWest IndiesWestern AfricaWestern AsiaWestern EuropeYemenZaireZimbabweAzores
Median Female Earnings
Income
Poverty
Unemployment
Labor Participation
Family Structure
Vehicle Availability
Education Level
Disability

Median Female Earnings Comparison

Hungarians

Trinidadians and Tobagonians

Average
Exceptional
$39,510
MEDIAN FEMALE EARNINGS
40.3/ 100
METRIC RATING
183rd/ 347
METRIC RANK
$40,958
MEDIAN FEMALE EARNINGS
93.2/ 100
METRIC RATING
124th/ 347
METRIC RANK

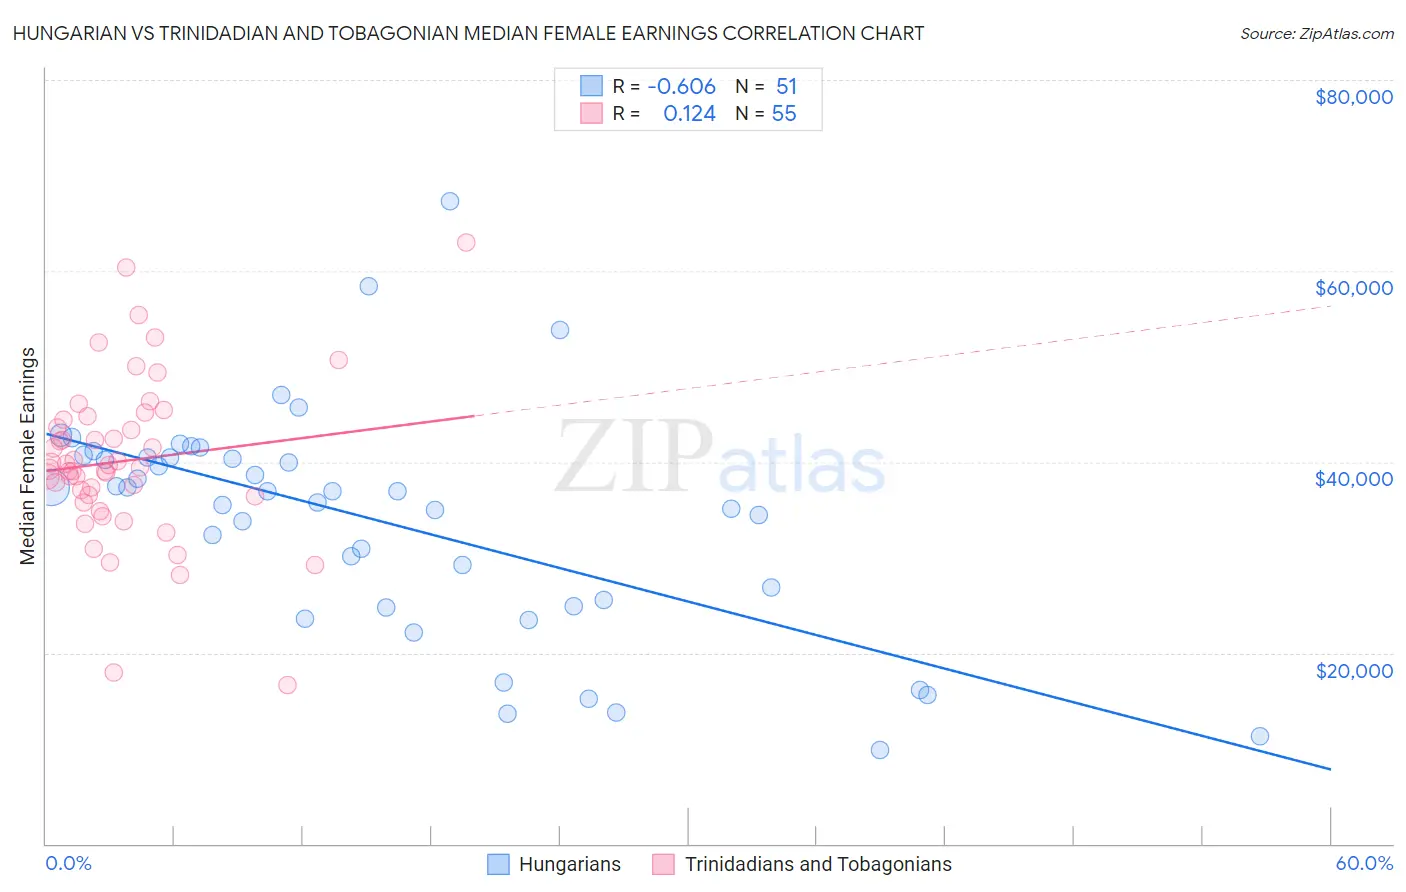
Hungarian vs Trinidadian and Tobagonian Median Female Earnings Correlation Chart

The statistical analysis conducted on geographies consisting of 485,733,652 people shows a significant negative correlation between the proportion of Hungarians and median female earnings in the United States with a correlation coefficient (R) of -0.606 and weighted average of $39,510. Similarly, the statistical analysis conducted on geographies consisting of 219,833,705 people shows a poor positive correlation between the proportion of Trinidadians and Tobagonians and median female earnings in the United States with a correlation coefficient (R) of 0.124 and weighted average of $40,958, a difference of 3.7%.
Hungarian vs Trinidadian and Tobagonian Median Female Earnings

Median Female Earnings Correlation Summary

MeasurementHungarianTrinidadian and Tobagonian
Minimum$9,845$16,600
Maximum$67,329$62,946
Range$57,484$46,346
Mean$33,736$40,097
Median$36,875$39,462
Interquartile 25% (IQ1)$24,845$36,442
Interquartile 75% (IQ3)$40,519$44,400
Interquartile Range (IQR)$15,674$7,958
Standard Deviation (Sample)$11,915$8,489
Standard Deviation (Population)$11,798$8,412

Similar Demographics by Median Female Earnings

Demographics Similar to Hungarians by Median Female Earnings

In terms of median female earnings, the demographic groups most similar to Hungarians are Tlingit-Haida ($39,513, a difference of 0.010%), Tsimshian ($39,530, a difference of 0.050%), Immigrants from Kenya ($39,535, a difference of 0.060%), European ($39,457, a difference of 0.13%), and Immigrants from West Indies ($39,441, a difference of 0.18%).
DemographicsRating | RankMedian Female Earnings
Nigerians
47.0
/100
|
#176
Average
$39,641
Costa Ricans
46.1
/100
|
#177
Average
$39,622
Slavs
45.6
/100
|
#178
Average
$39,613
Immigrants | Germany
45.1
/100
|
#179
Average
$39,603
Immigrants | Kenya
41.6
/100
|
#180
Average
$39,535
Tsimshian
41.4
/100
|
#181
Average
$39,530
Tlingit-Haida
40.5
/100
|
#182
Average
$39,513
Hungarians
40.3
/100
|
#183
Average
$39,510
Europeans
37.7
/100
|
#184
Fair
$39,457
Immigrants | West Indies
36.9
/100
|
#185
Fair
$39,441
Colombians
36.9
/100
|
#186
Fair
$39,439
Swedes
36.0
/100
|
#187
Fair
$39,421
Bermudans
35.9
/100
|
#188
Fair
$39,418
Senegalese
34.2
/100
|
#189
Fair
$39,384
Puget Sound Salish
33.9
/100
|
#190
Fair
$39,376

Demographics Similar to Trinidadians and Tobagonians by Median Female Earnings

In terms of median female earnings, the demographic groups most similar to Trinidadians and Tobagonians are Guyanese ($40,973, a difference of 0.040%), Immigrants from Jordan ($40,977, a difference of 0.050%), Croatian ($40,993, a difference of 0.090%), Austrian ($40,923, a difference of 0.090%), and Immigrants from Trinidad and Tobago ($40,895, a difference of 0.15%).
DemographicsRating | RankMedian Female Earnings
Barbadians
96.3
/100
|
#117
Exceptional
$41,261
Immigrants | Lebanon
95.6
/100
|
#118
Exceptional
$41,183
Immigrants | Philippines
95.0
/100
|
#119
Exceptional
$41,114
Immigrants | Kuwait
94.4
/100
|
#120
Exceptional
$41,055
Croatians
93.7
/100
|
#121
Exceptional
$40,993
Immigrants | Jordan
93.5
/100
|
#122
Exceptional
$40,977
Guyanese
93.4
/100
|
#123
Exceptional
$40,973
Trinidadians and Tobagonians
93.2
/100
|
#124
Exceptional
$40,958
Austrians
92.7
/100
|
#125
Exceptional
$40,923
Immigrants | Trinidad and Tobago
92.3
/100
|
#126
Exceptional
$40,895
Ugandans
92.2
/100
|
#127
Exceptional
$40,889
Carpatho Rusyns
91.2
/100
|
#128
Exceptional
$40,825
Zimbabweans
90.8
/100
|
#129
Exceptional
$40,798
Immigrants | Guyana
90.3
/100
|
#130
Exceptional
$40,773
Chileans
90.0
/100
|
#131
Exceptional
$40,757