Hungarian vs Mongolian Median Female Earnings
COMPARE
Hungarian
Mongolian
Median Female Earnings
Median Female Earnings Comparison
Hungarians
Mongolians
$39,510
MEDIAN FEMALE EARNINGS
40.3/ 100
METRIC RATING
183rd/ 347
METRIC RANK
$42,542
MEDIAN FEMALE EARNINGS
99.7/ 100
METRIC RATING
73rd/ 347
METRIC RANK
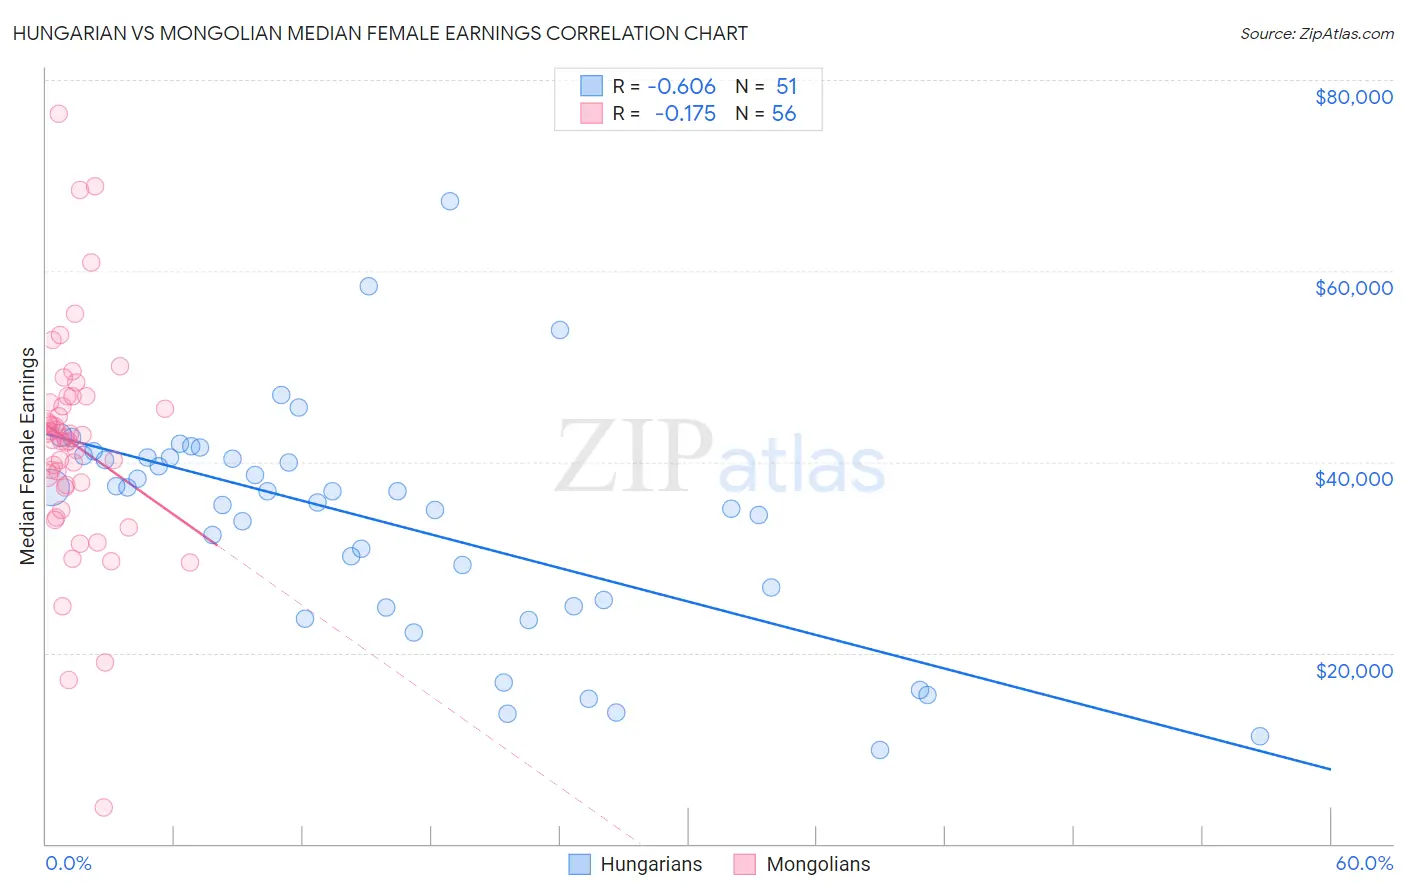
Hungarian vs Mongolian Median Female Earnings Correlation Chart
The statistical analysis conducted on geographies consisting of 485,733,652 people shows a significant negative correlation between the proportion of Hungarians and median female earnings in the United States with a correlation coefficient (R) of -0.606 and weighted average of $39,510. Similarly, the statistical analysis conducted on geographies consisting of 140,350,842 people shows a poor negative correlation between the proportion of Mongolians and median female earnings in the United States with a correlation coefficient (R) of -0.175 and weighted average of $42,542, a difference of 7.7%.
Median Female Earnings Correlation Summary
| Measurement | Hungarian | Mongolian |
| Minimum | $9,845 | $3,764 |
| Maximum | $67,329 | $76,486 |
| Range | $57,484 | $72,722 |
| Mean | $33,736 | $41,823 |
| Median | $36,875 | $42,408 |
| Interquartile 25% (IQ1) | $24,845 | $37,469 |
| Interquartile 75% (IQ3) | $40,519 | $46,493 |
| Interquartile Range (IQR) | $15,674 | $9,024 |
| Standard Deviation (Sample) | $11,915 | $11,821 |
| Standard Deviation (Population) | $11,798 | $11,715 |
Similar Demographics by Median Female Earnings
Demographics Similar to Hungarians by Median Female Earnings
In terms of median female earnings, the demographic groups most similar to Hungarians are Tlingit-Haida ($39,513, a difference of 0.010%), Tsimshian ($39,530, a difference of 0.050%), Immigrants from Kenya ($39,535, a difference of 0.060%), European ($39,457, a difference of 0.13%), and Immigrants from West Indies ($39,441, a difference of 0.18%).
| Demographics | Rating | Rank | Median Female Earnings |
| Nigerians | 47.0 /100 | #176 | Average $39,641 |
| Costa Ricans | 46.1 /100 | #177 | Average $39,622 |
| Slavs | 45.6 /100 | #178 | Average $39,613 |
| Immigrants | Germany | 45.1 /100 | #179 | Average $39,603 |
| Immigrants | Kenya | 41.6 /100 | #180 | Average $39,535 |
| Tsimshian | 41.4 /100 | #181 | Average $39,530 |
| Tlingit-Haida | 40.5 /100 | #182 | Average $39,513 |
| Hungarians | 40.3 /100 | #183 | Average $39,510 |
| Europeans | 37.7 /100 | #184 | Fair $39,457 |
| Immigrants | West Indies | 36.9 /100 | #185 | Fair $39,441 |
| Colombians | 36.9 /100 | #186 | Fair $39,439 |
| Swedes | 36.0 /100 | #187 | Fair $39,421 |
| Bermudans | 35.9 /100 | #188 | Fair $39,418 |
| Senegalese | 34.2 /100 | #189 | Fair $39,384 |
| Puget Sound Salish | 33.9 /100 | #190 | Fair $39,376 |
Demographics Similar to Mongolians by Median Female Earnings
In terms of median female earnings, the demographic groups most similar to Mongolians are Immigrants from South Africa ($42,508, a difference of 0.080%), Albanian ($42,584, a difference of 0.10%), New Zealander ($42,446, a difference of 0.23%), Immigrants from Italy ($42,446, a difference of 0.23%), and Immigrants from Albania ($42,388, a difference of 0.36%).
| Demographics | Rating | Rank | Median Female Earnings |
| Immigrants | Norway | 99.9 /100 | #66 | Exceptional $42,837 |
| Immigrants | Egypt | 99.9 /100 | #67 | Exceptional $42,837 |
| Immigrants | Austria | 99.8 /100 | #68 | Exceptional $42,824 |
| Immigrants | Spain | 99.8 /100 | #69 | Exceptional $42,815 |
| Immigrants | Ethiopia | 99.8 /100 | #70 | Exceptional $42,744 |
| Immigrants | Romania | 99.8 /100 | #71 | Exceptional $42,718 |
| Albanians | 99.8 /100 | #72 | Exceptional $42,584 |
| Mongolians | 99.7 /100 | #73 | Exceptional $42,542 |
| Immigrants | South Africa | 99.7 /100 | #74 | Exceptional $42,508 |
| New Zealanders | 99.7 /100 | #75 | Exceptional $42,446 |
| Immigrants | Italy | 99.7 /100 | #76 | Exceptional $42,446 |
| Immigrants | Albania | 99.6 /100 | #77 | Exceptional $42,388 |
| Immigrants | Kazakhstan | 99.6 /100 | #78 | Exceptional $42,386 |
| Greeks | 99.6 /100 | #79 | Exceptional $42,336 |
| Immigrants | Moldova | 99.6 /100 | #80 | Exceptional $42,304 |