Immigrants from South Central Asia vs Immigrants from Serbia Per Capita Income
COMPARE
Immigrants from South Central Asia
Immigrants from Serbia
Per Capita Income
Per Capita Income Comparison
Immigrants from South Central Asia
Immigrants from Serbia
$52,660
PER CAPITA INCOME
100.0/ 100
METRIC RATING
27th/ 347
METRIC RANK
$50,810
PER CAPITA INCOME
100.0/ 100
METRIC RATING
48th/ 347
METRIC RANK
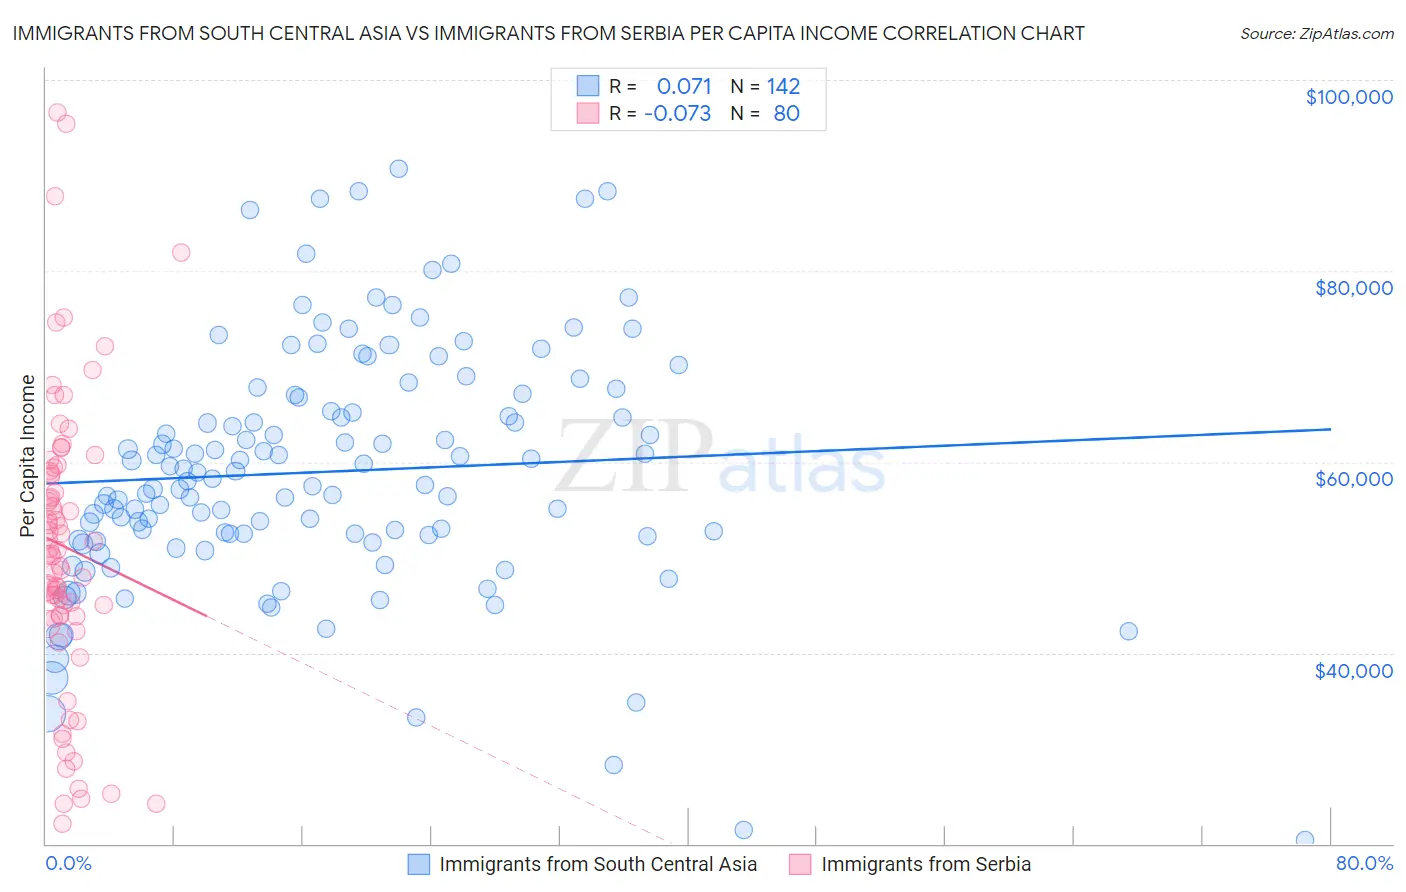
Immigrants from South Central Asia vs Immigrants from Serbia Per Capita Income Correlation Chart
The statistical analysis conducted on geographies consisting of 473,150,606 people shows a slight positive correlation between the proportion of Immigrants from South Central Asia and per capita income in the United States with a correlation coefficient (R) of 0.071 and weighted average of $52,660. Similarly, the statistical analysis conducted on geographies consisting of 131,748,543 people shows a slight negative correlation between the proportion of Immigrants from Serbia and per capita income in the United States with a correlation coefficient (R) of -0.073 and weighted average of $50,810, a difference of 3.6%.
Per Capita Income Correlation Summary
| Measurement | Immigrants from South Central Asia | Immigrants from Serbia |
| Minimum | $20,428 | $22,149 |
| Maximum | $90,751 | $96,565 |
| Range | $70,323 | $74,416 |
| Mean | $58,959 | $51,095 |
| Median | $58,134 | $50,532 |
| Interquartile 25% (IQ1) | $52,199 | $43,814 |
| Interquartile 75% (IQ3) | $66,712 | $59,208 |
| Interquartile Range (IQR) | $14,513 | $15,394 |
| Standard Deviation (Sample) | $12,766 | $15,421 |
| Standard Deviation (Population) | $12,721 | $15,324 |
Similar Demographics by Per Capita Income
Demographics Similar to Immigrants from South Central Asia by Per Capita Income
In terms of per capita income, the demographic groups most similar to Immigrants from South Central Asia are Latvian ($52,649, a difference of 0.020%), Israeli ($52,596, a difference of 0.12%), Immigrants from Austria ($52,503, a difference of 0.30%), Turkish ($52,391, a difference of 0.51%), and Immigrants from Norway ($52,217, a difference of 0.85%).
| Demographics | Rating | Rank | Per Capita Income |
| Soviet Union | 100.0 /100 | #20 | Exceptional $54,202 |
| Immigrants | Northern Europe | 100.0 /100 | #21 | Exceptional $54,159 |
| Indians (Asian) | 100.0 /100 | #22 | Exceptional $53,874 |
| Immigrants | Eastern Asia | 100.0 /100 | #23 | Exceptional $53,806 |
| Immigrants | Denmark | 100.0 /100 | #24 | Exceptional $53,799 |
| Immigrants | Japan | 100.0 /100 | #25 | Exceptional $53,359 |
| Russians | 100.0 /100 | #26 | Exceptional $53,154 |
| Immigrants | South Central Asia | 100.0 /100 | #27 | Exceptional $52,660 |
| Latvians | 100.0 /100 | #28 | Exceptional $52,649 |
| Israelis | 100.0 /100 | #29 | Exceptional $52,596 |
| Immigrants | Austria | 100.0 /100 | #30 | Exceptional $52,503 |
| Turks | 100.0 /100 | #31 | Exceptional $52,391 |
| Immigrants | Norway | 100.0 /100 | #32 | Exceptional $52,217 |
| Australians | 100.0 /100 | #33 | Exceptional $52,074 |
| Immigrants | Russia | 100.0 /100 | #34 | Exceptional $52,044 |
Demographics Similar to Immigrants from Serbia by Per Capita Income
In terms of per capita income, the demographic groups most similar to Immigrants from Serbia are Bulgarian ($50,906, a difference of 0.19%), Immigrants from Latvia ($50,914, a difference of 0.21%), Immigrants from Spain ($50,933, a difference of 0.24%), Immigrants from Europe ($50,950, a difference of 0.28%), and New Zealander ($50,575, a difference of 0.46%).
| Demographics | Rating | Rank | Per Capita Income |
| Immigrants | South Africa | 100.0 /100 | #41 | Exceptional $51,465 |
| Immigrants | Turkey | 100.0 /100 | #42 | Exceptional $51,368 |
| Immigrants | Lithuania | 100.0 /100 | #43 | Exceptional $51,361 |
| Immigrants | Europe | 100.0 /100 | #44 | Exceptional $50,950 |
| Immigrants | Spain | 100.0 /100 | #45 | Exceptional $50,933 |
| Immigrants | Latvia | 100.0 /100 | #46 | Exceptional $50,914 |
| Bulgarians | 100.0 /100 | #47 | Exceptional $50,906 |
| Immigrants | Serbia | 100.0 /100 | #48 | Exceptional $50,810 |
| New Zealanders | 100.0 /100 | #49 | Exceptional $50,575 |
| Immigrants | Sri Lanka | 100.0 /100 | #50 | Exceptional $50,555 |
| Immigrants | Netherlands | 100.0 /100 | #51 | Exceptional $50,458 |
| Immigrants | Croatia | 99.9 /100 | #52 | Exceptional $50,417 |
| Paraguayans | 99.9 /100 | #53 | Exceptional $50,385 |
| Immigrants | Belarus | 99.9 /100 | #54 | Exceptional $50,303 |
| Immigrants | Western Europe | 99.9 /100 | #55 | Exceptional $50,065 |