Malaysian vs Immigrants from Serbia Per Capita Income
COMPARE
Malaysian
Immigrants from Serbia
Per Capita Income
Per Capita Income Comparison
Malaysians
Immigrants from Serbia
$39,194
PER CAPITA INCOME
0.7/ 100
METRIC RATING
259th/ 347
METRIC RANK
$50,810
PER CAPITA INCOME
100.0/ 100
METRIC RATING
48th/ 347
METRIC RANK
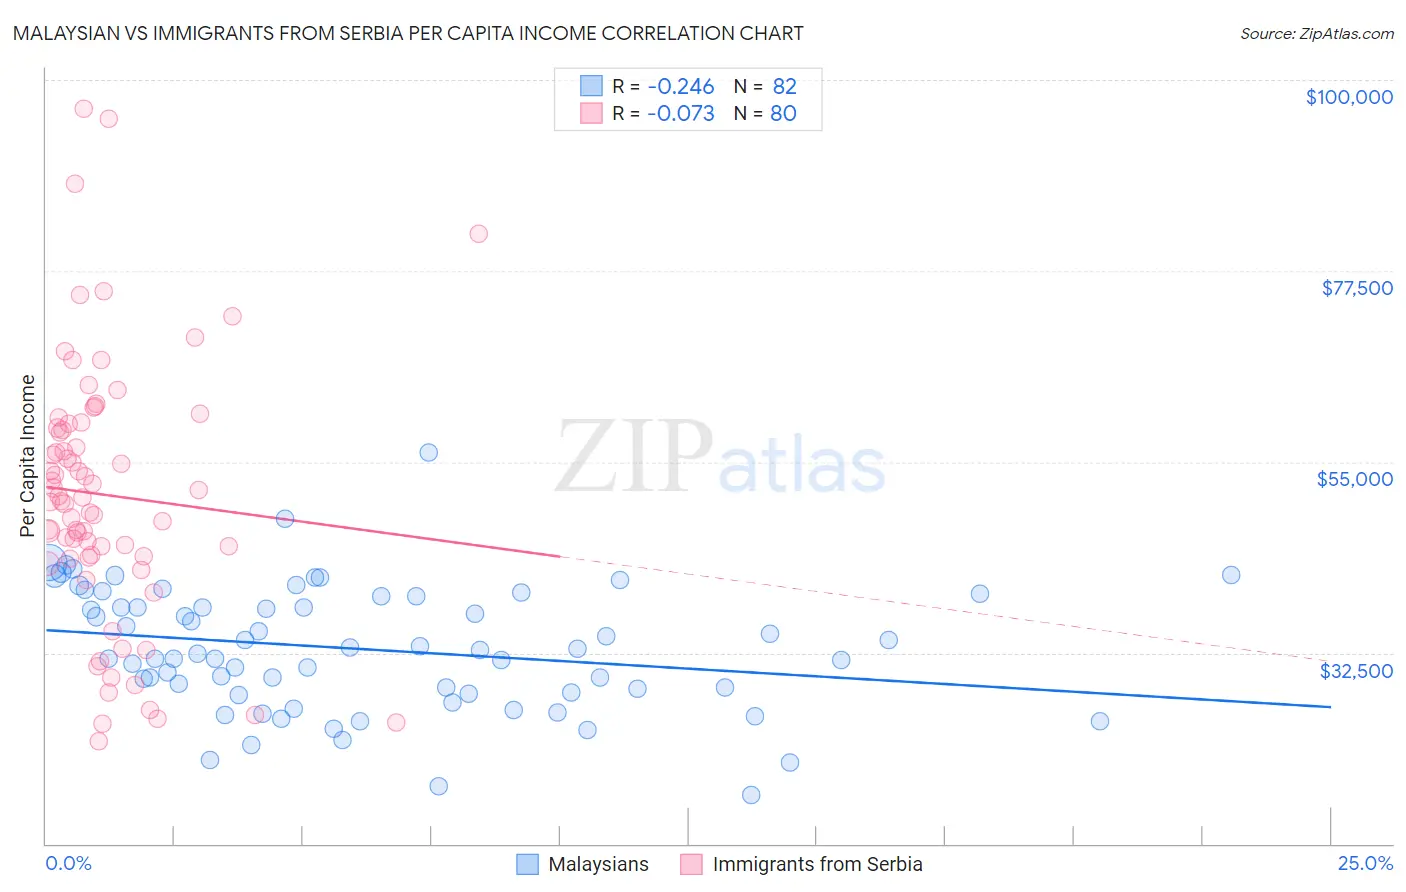
Malaysian vs Immigrants from Serbia Per Capita Income Correlation Chart
The statistical analysis conducted on geographies consisting of 226,115,655 people shows a weak negative correlation between the proportion of Malaysians and per capita income in the United States with a correlation coefficient (R) of -0.246 and weighted average of $39,194. Similarly, the statistical analysis conducted on geographies consisting of 131,748,543 people shows a slight negative correlation between the proportion of Immigrants from Serbia and per capita income in the United States with a correlation coefficient (R) of -0.073 and weighted average of $50,810, a difference of 29.6%.
Per Capita Income Correlation Summary
| Measurement | Malaysian | Immigrants from Serbia |
| Minimum | $15,753 | $22,149 |
| Maximum | $56,163 | $96,565 |
| Range | $40,410 | $74,416 |
| Mean | $32,947 | $51,095 |
| Median | $32,625 | $50,532 |
| Interquartile 25% (IQ1) | $27,821 | $43,814 |
| Interquartile 75% (IQ3) | $39,160 | $59,208 |
| Interquartile Range (IQR) | $11,339 | $15,394 |
| Standard Deviation (Sample) | $7,360 | $15,421 |
| Standard Deviation (Population) | $7,315 | $15,324 |
Similar Demographics by Per Capita Income
Demographics Similar to Malaysians by Per Capita Income
In terms of per capita income, the demographic groups most similar to Malaysians are Alaskan Athabascan ($39,163, a difference of 0.080%), Jamaican ($39,231, a difference of 0.090%), Marshallese ($39,108, a difference of 0.22%), Iroquois ($39,104, a difference of 0.23%), and Belizean ($39,097, a difference of 0.25%).
| Demographics | Rating | Rank | Per Capita Income |
| Immigrants | Azores | 1.0 /100 | #252 | Tragic $39,608 |
| Osage | 1.0 /100 | #253 | Tragic $39,568 |
| Alaska Natives | 1.0 /100 | #254 | Tragic $39,558 |
| Immigrants | Middle Africa | 1.0 /100 | #255 | Tragic $39,529 |
| Hawaiians | 0.8 /100 | #256 | Tragic $39,403 |
| Nicaraguans | 0.8 /100 | #257 | Tragic $39,372 |
| Jamaicans | 0.7 /100 | #258 | Tragic $39,231 |
| Malaysians | 0.7 /100 | #259 | Tragic $39,194 |
| Alaskan Athabascans | 0.6 /100 | #260 | Tragic $39,163 |
| Marshallese | 0.6 /100 | #261 | Tragic $39,108 |
| Iroquois | 0.6 /100 | #262 | Tragic $39,104 |
| Belizeans | 0.6 /100 | #263 | Tragic $39,097 |
| Americans | 0.6 /100 | #264 | Tragic $39,039 |
| Spanish Americans | 0.5 /100 | #265 | Tragic $39,012 |
| Salvadorans | 0.5 /100 | #266 | Tragic $38,858 |
Demographics Similar to Immigrants from Serbia by Per Capita Income
In terms of per capita income, the demographic groups most similar to Immigrants from Serbia are Bulgarian ($50,906, a difference of 0.19%), Immigrants from Latvia ($50,914, a difference of 0.21%), Immigrants from Spain ($50,933, a difference of 0.24%), Immigrants from Europe ($50,950, a difference of 0.28%), and New Zealander ($50,575, a difference of 0.46%).
| Demographics | Rating | Rank | Per Capita Income |
| Immigrants | South Africa | 100.0 /100 | #41 | Exceptional $51,465 |
| Immigrants | Turkey | 100.0 /100 | #42 | Exceptional $51,368 |
| Immigrants | Lithuania | 100.0 /100 | #43 | Exceptional $51,361 |
| Immigrants | Europe | 100.0 /100 | #44 | Exceptional $50,950 |
| Immigrants | Spain | 100.0 /100 | #45 | Exceptional $50,933 |
| Immigrants | Latvia | 100.0 /100 | #46 | Exceptional $50,914 |
| Bulgarians | 100.0 /100 | #47 | Exceptional $50,906 |
| Immigrants | Serbia | 100.0 /100 | #48 | Exceptional $50,810 |
| New Zealanders | 100.0 /100 | #49 | Exceptional $50,575 |
| Immigrants | Sri Lanka | 100.0 /100 | #50 | Exceptional $50,555 |
| Immigrants | Netherlands | 100.0 /100 | #51 | Exceptional $50,458 |
| Immigrants | Croatia | 99.9 /100 | #52 | Exceptional $50,417 |
| Paraguayans | 99.9 /100 | #53 | Exceptional $50,385 |
| Immigrants | Belarus | 99.9 /100 | #54 | Exceptional $50,303 |
| Immigrants | Western Europe | 99.9 /100 | #55 | Exceptional $50,065 |