Lithuanian vs Immigrants from Serbia Per Capita Income

COMPARE

Lithuanian
Race
Ancestry
AfghanAfricanAlaska NativeAlaskan AthabascanAlbanianAleutAlsatianAmericanApacheArabArapahoArgentineanArmenianAssyrian/Chaldean/SyriacAustralianAustrianBahamianBangladeshiBarbadianBasqueBelgianBelizeanBermudanBhutaneseBlackfeetBolivianBrazilianBritishBritish West IndianBulgarianBurmeseCajunCambodianCanadianCape VerdeanCarpatho RusynCelticCentral AmericanCentral American IndianCherokeeCheyenneChickasawChileanChineseChippewaChoctawColombianColvilleComancheCosta RicanCreeCreekCroatianCrowCubanCypriotCzechCzechoslovakianDanishDelawareDominicanDutchDutch West IndianEastern EuropeanEcuadorianEgyptianEnglishEstonianEthiopianEuropeanFijianFilipinoFinnishFrenchFrench American IndianFrench CanadianGermanGerman RussianGhanaianGreekGuamanian/ChamorroGuatemalanGuyaneseHaitianHmongHonduranHopiHoumaHungarianIcelanderIndian (Asian)IndonesianInupiatIranianIraqiIrishIroquoisIsraeliItalianJamaicanJapaneseJordanianKenyanKiowaKoreanLaotianLatvianLebaneseLiberianLithuanianLumbeeLuxembourgerMacedonianMalaysianMalteseMarshalleseMenomineeMexicanMexican American IndianMongolianMoroccanNative HawaiianNavajoNepaleseNew ZealanderNicaraguanNigerianNorthern EuropeanNorwegianOkinawanOsageOttawaPaiutePakistaniPalestinianPanamanianParaguayanPennsylvania GermanPeruvianPimaPolishPortuguesePotawatomiPuebloPuerto RicanPuget Sound SalishRomanianRussianSalvadoranSamoanScandinavianScotch-IrishScottishSeminoleSenegaleseSerbianShoshoneSierra LeoneanSiouxSlavicSlovakSloveneSomaliSouth AfricanSouth AmericanSouth American IndianSoviet UnionSpaniardSpanishSpanish AmericanSpanish American IndianSri LankanSubsaharan AfricanSudaneseSwedishSwissSyrianTaiwaneseThaiTlingit-HaidaTohono O'OdhamTonganTrinidadian and TobagonianTsimshianTurkishU.S. Virgin IslanderUgandanUkrainianUruguayanUteVenezuelanVietnameseWelshWest IndianYakamaYaquiYugoslavianYumanYup'ikZimbabwean
Immigration
NonimmigrantsImmigrantsAfghanistanAfricaAlbaniaArgentinaArmeniaAsiaAustraliaAustriaBahamasBangladeshBarbadosBelarusBelgiumBelizeBoliviaBosnia and HerzegovinaBrazilBulgariaBurma/MyanmarCabo VerdeCambodiaCameroonCanadaCaribbeanCentral AmericaChileChinaColombiaCongoCosta RicaCroatiaCubaCzechoslovakiaDenmarkDominicaDominican RepublicEastern AfricaEastern AsiaEastern EuropeEcuadorEgyptEl SalvadorEnglandEritreaEthiopiaEuropeFijiFranceGermanyGhanaGreeceGrenadaGuatemalaGuyanaHaitiHondurasHong KongHungaryIndiaIndonesiaIranIraqIrelandIsraelItalyJamaicaJapanJordanKazakhstanKenyaKoreaKuwaitLaosLatin AmericaLatviaLebanonLiberiaLithuaniaMalaysiaMexicoMicronesiaMiddle AfricaMoldovaMoroccoNepalNetherlandsNicaraguaNigeriaNorth AmericaNorth MacedoniaNorthern AfricaNorthern EuropeNorwayOceaniaPakistanPanamaPeruPhilippinesPolandPortugalRomaniaRussiaSaudi ArabiaScotlandSenegalSierra LeoneSingaporeSomaliaSouth AfricaSouth AmericaSouth Central AsiaSouth Eastern AsiaSouthern EuropeSpainSri LankaSt. Vincent and the GrenadinesSudanSwedenSwitzerlandSyriaTaiwanThailandTrinidad and TobagoTurkeyUgandaUkraineUruguayUzbekistanVenezuelaVietnamWest IndiesWestern AfricaWestern AsiaWestern EuropeYemenZaireZimbabweAzores
Immigrants from Serbia
Race
Ancestry
AfghanAfricanAlaska NativeAlaskan AthabascanAlbanianAleutAlsatianAmericanApacheArabArapahoArgentineanArmenianAssyrian/Chaldean/SyriacAustralianAustrianBahamianBangladeshiBarbadianBasqueBelgianBelizeanBermudanBhutaneseBlackfeetBolivianBrazilianBritishBritish West IndianBulgarianBurmeseCajunCambodianCanadianCape VerdeanCarpatho RusynCelticCentral AmericanCentral American IndianCherokeeCheyenneChickasawChileanChineseChippewaChoctawColombianColvilleComancheCosta RicanCreeCreekCroatianCrowCubanCypriotCzechCzechoslovakianDanishDelawareDominicanDutchDutch West IndianEastern EuropeanEcuadorianEgyptianEnglishEstonianEthiopianEuropeanFijianFilipinoFinnishFrenchFrench American IndianFrench CanadianGermanGerman RussianGhanaianGreekGuamanian/ChamorroGuatemalanGuyaneseHaitianHmongHonduranHopiHoumaHungarianIcelanderIndian (Asian)IndonesianInupiatIranianIraqiIrishIroquoisIsraeliItalianJamaicanJapaneseJordanianKenyanKiowaKoreanLaotianLatvianLebaneseLiberianLumbeeLuxembourgerMacedonianMalaysianMalteseMarshalleseMenomineeMexicanMexican American IndianMongolianMoroccanNative HawaiianNavajoNepaleseNew ZealanderNicaraguanNigerianNorthern EuropeanNorwegianOkinawanOsageOttawaPaiutePakistaniPalestinianPanamanianParaguayanPennsylvania GermanPeruvianPimaPolishPortuguesePotawatomiPuebloPuerto RicanPuget Sound SalishRomanianRussianSalvadoranSamoanScandinavianScotch-IrishScottishSeminoleSenegaleseSerbianShoshoneSierra LeoneanSiouxSlavicSlovakSloveneSomaliSouth AfricanSouth AmericanSouth American IndianSoviet UnionSpaniardSpanishSpanish AmericanSpanish American IndianSri LankanSubsaharan AfricanSudaneseSwedishSwissSyrianTaiwaneseThaiTlingit-HaidaTohono O'OdhamTonganTrinidadian and TobagonianTsimshianTurkishU.S. Virgin IslanderUgandanUkrainianUruguayanUteVenezuelanVietnameseWelshWest IndianYakamaYaquiYugoslavianYumanYup'ikZimbabwean
Immigration
NonimmigrantsImmigrantsAfghanistanAfricaAlbaniaArgentinaArmeniaAsiaAustraliaAustriaBahamasBangladeshBarbadosBelarusBelgiumBelizeBoliviaBosnia and HerzegovinaBrazilBulgariaBurma/MyanmarCabo VerdeCambodiaCameroonCanadaCaribbeanCentral AmericaChileChinaColombiaCongoCosta RicaCroatiaCubaCzechoslovakiaDenmarkDominicaDominican RepublicEastern AfricaEastern AsiaEastern EuropeEcuadorEgyptEl SalvadorEnglandEritreaEthiopiaEuropeFijiFranceGermanyGhanaGreeceGrenadaGuatemalaGuyanaHaitiHondurasHong KongHungaryIndiaIndonesiaIranIraqIrelandIsraelItalyJamaicaJapanJordanKazakhstanKenyaKoreaKuwaitLaosLatin AmericaLatviaLebanonLiberiaLithuaniaMalaysiaMexicoMicronesiaMiddle AfricaMoldovaMoroccoNepalNetherlandsNicaraguaNigeriaNorth AmericaNorth MacedoniaNorthern AfricaNorthern EuropeNorwayOceaniaPakistanPanamaPeruPhilippinesPolandPortugalRomaniaRussiaSaudi ArabiaScotlandSenegalSerbiaSierra LeoneSingaporeSomaliaSouth AfricaSouth AmericaSouth Central AsiaSouth Eastern AsiaSouthern EuropeSpainSri LankaSt. Vincent and the GrenadinesSudanSwedenSwitzerlandSyriaTaiwanThailandTrinidad and TobagoTurkeyUgandaUkraineUruguayUzbekistanVenezuelaVietnamWest IndiesWestern AfricaWestern AsiaWestern EuropeYemenZaireZimbabweAzores
Per Capita Income
Income
Poverty
Unemployment
Labor Participation
Family Structure
Vehicle Availability
Education Level
Disability

Per Capita Income Comparison

Lithuanians

Immigrants from Serbia

Exceptional
Exceptional
$49,448
PER CAPITA INCOME
99.8/ 100
METRIC RATING
68th/ 347
METRIC RANK
$50,810
PER CAPITA INCOME
100.0/ 100
METRIC RATING
48th/ 347
METRIC RANK

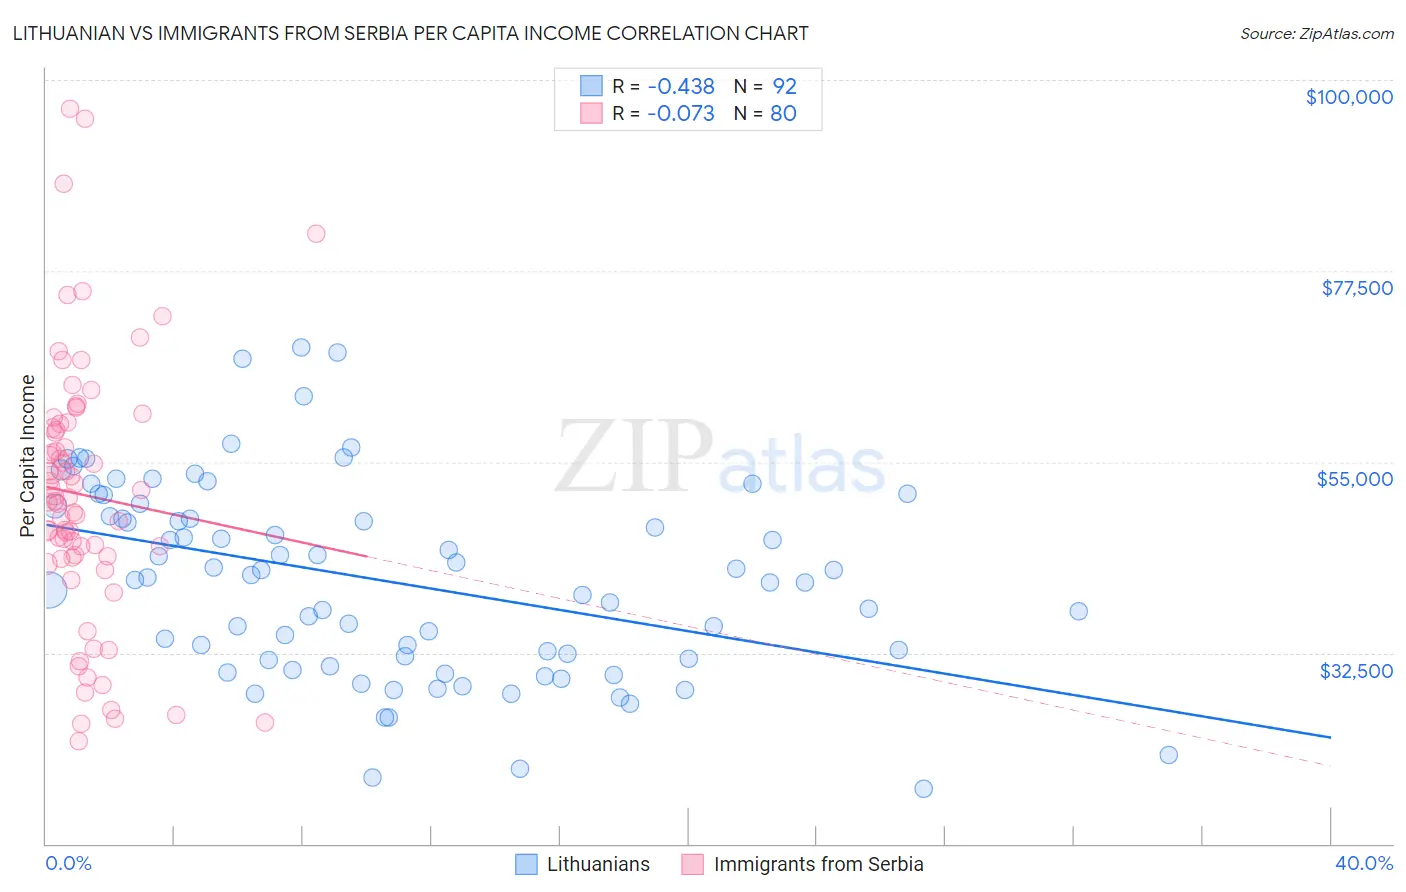
Lithuanian vs Immigrants from Serbia Per Capita Income Correlation Chart

The statistical analysis conducted on geographies consisting of 421,963,914 people shows a moderate negative correlation between the proportion of Lithuanians and per capita income in the United States with a correlation coefficient (R) of -0.438 and weighted average of $49,448. Similarly, the statistical analysis conducted on geographies consisting of 131,748,543 people shows a slight negative correlation between the proportion of Immigrants from Serbia and per capita income in the United States with a correlation coefficient (R) of -0.073 and weighted average of $50,810, a difference of 2.8%.
Lithuanian vs Immigrants from Serbia Per Capita Income

Per Capita Income Correlation Summary

MeasurementLithuanianImmigrants from Serbia
Minimum$16,487$22,149
Maximum$68,542$96,565
Range$52,055$74,416
Mean$40,931$51,095
Median$41,220$50,532
Interquartile 25% (IQ1)$31,717$43,814
Interquartile 75% (IQ3)$49,156$59,208
Interquartile Range (IQR)$17,439$15,394
Standard Deviation (Sample)$11,469$15,421
Standard Deviation (Population)$11,406$15,324

Demographics Similar to Lithuanians and Immigrants from Serbia by Per Capita Income

In terms of per capita income, the demographic groups most similar to Lithuanians are Immigrants from Romania ($49,463, a difference of 0.030%), Immigrants from Bulgaria ($49,482, a difference of 0.070%), Bolivian ($49,526, a difference of 0.16%), Immigrants from Argentina ($49,627, a difference of 0.36%), and Maltese ($49,640, a difference of 0.39%). Similarly, the demographic groups most similar to Immigrants from Serbia are New Zealander ($50,575, a difference of 0.46%), Immigrants from Sri Lanka ($50,555, a difference of 0.50%), Immigrants from Netherlands ($50,458, a difference of 0.70%), Immigrants from Croatia ($50,417, a difference of 0.78%), and Paraguayan ($50,385, a difference of 0.84%).
DemographicsRating | RankPer Capita Income
Immigrants | Serbia
100.0
/100
|
#48
Exceptional
$50,810
New Zealanders
100.0
/100
|
#49
Exceptional
$50,575
Immigrants | Sri Lanka
100.0
/100
|
#50
Exceptional
$50,555
Immigrants | Netherlands
100.0
/100
|
#51
Exceptional
$50,458
Immigrants | Croatia
99.9
/100
|
#52
Exceptional
$50,417
Paraguayans
99.9
/100
|
#53
Exceptional
$50,385
Immigrants | Belarus
99.9
/100
|
#54
Exceptional
$50,303
Immigrants | Western Europe
99.9
/100
|
#55
Exceptional
$50,065
Asians
99.9
/100
|
#56
Exceptional
$50,057
South Africans
99.9
/100
|
#57
Exceptional
$50,044
Immigrants | Malaysia
99.9
/100
|
#58
Exceptional
$49,983
Bhutanese
99.9
/100
|
#59
Exceptional
$49,894
Immigrants | Scotland
99.9
/100
|
#60
Exceptional
$49,893
Argentineans
99.9
/100
|
#61
Exceptional
$49,862
Immigrants | Asia
99.9
/100
|
#62
Exceptional
$49,741
Maltese
99.9
/100
|
#63
Exceptional
$49,640
Immigrants | Argentina
99.9
/100
|
#64
Exceptional
$49,627
Bolivians
99.9
/100
|
#65
Exceptional
$49,526
Immigrants | Bulgaria
99.9
/100
|
#66
Exceptional
$49,482
Immigrants | Romania
99.9
/100
|
#67
Exceptional
$49,463
Lithuanians
99.8
/100
|
#68
Exceptional
$49,448