Immigrants from Belarus vs Immigrants from Uruguay Per Capita Income
COMPARE
Immigrants from Belarus
Immigrants from Uruguay
Per Capita Income
Per Capita Income Comparison
Immigrants from Belarus
Immigrants from Uruguay
$50,303
PER CAPITA INCOME
99.9/ 100
METRIC RATING
54th/ 347
METRIC RANK
$43,997
PER CAPITA INCOME
59.3/ 100
METRIC RATING
166th/ 347
METRIC RANK
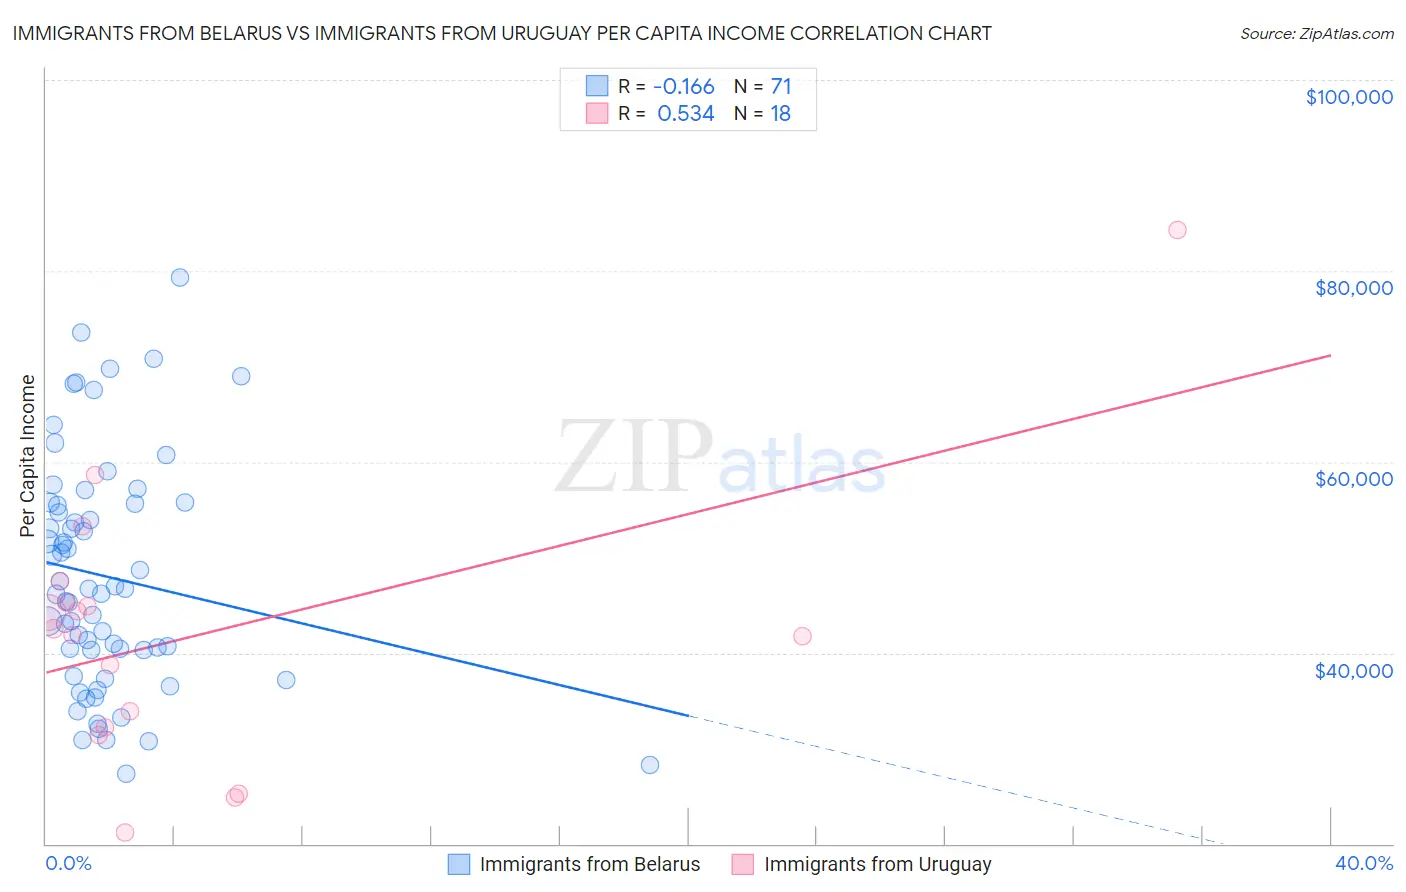
Immigrants from Belarus vs Immigrants from Uruguay Per Capita Income Correlation Chart
The statistical analysis conducted on geographies consisting of 150,188,651 people shows a poor negative correlation between the proportion of Immigrants from Belarus and per capita income in the United States with a correlation coefficient (R) of -0.166 and weighted average of $50,303. Similarly, the statistical analysis conducted on geographies consisting of 133,259,667 people shows a substantial positive correlation between the proportion of Immigrants from Uruguay and per capita income in the United States with a correlation coefficient (R) of 0.534 and weighted average of $43,997, a difference of 14.3%.
Per Capita Income Correlation Summary
| Measurement | Immigrants from Belarus | Immigrants from Uruguay |
| Minimum | $27,382 | $21,194 |
| Maximum | $79,346 | $84,313 |
| Range | $51,964 | $63,119 |
| Mean | $47,977 | $42,012 |
| Median | $46,691 | $42,230 |
| Interquartile 25% (IQ1) | $40,275 | $32,137 |
| Interquartile 75% (IQ3) | $55,569 | $45,280 |
| Interquartile Range (IQR) | $15,294 | $13,143 |
| Standard Deviation (Sample) | $11,980 | $14,447 |
| Standard Deviation (Population) | $11,895 | $14,040 |
Similar Demographics by Per Capita Income
Demographics Similar to Immigrants from Belarus by Per Capita Income
In terms of per capita income, the demographic groups most similar to Immigrants from Belarus are Paraguayan ($50,385, a difference of 0.16%), Immigrants from Croatia ($50,417, a difference of 0.23%), Immigrants from Netherlands ($50,458, a difference of 0.31%), Immigrants from Western Europe ($50,065, a difference of 0.48%), and Asian ($50,057, a difference of 0.49%).
| Demographics | Rating | Rank | Per Capita Income |
| Bulgarians | 100.0 /100 | #47 | Exceptional $50,906 |
| Immigrants | Serbia | 100.0 /100 | #48 | Exceptional $50,810 |
| New Zealanders | 100.0 /100 | #49 | Exceptional $50,575 |
| Immigrants | Sri Lanka | 100.0 /100 | #50 | Exceptional $50,555 |
| Immigrants | Netherlands | 100.0 /100 | #51 | Exceptional $50,458 |
| Immigrants | Croatia | 99.9 /100 | #52 | Exceptional $50,417 |
| Paraguayans | 99.9 /100 | #53 | Exceptional $50,385 |
| Immigrants | Belarus | 99.9 /100 | #54 | Exceptional $50,303 |
| Immigrants | Western Europe | 99.9 /100 | #55 | Exceptional $50,065 |
| Asians | 99.9 /100 | #56 | Exceptional $50,057 |
| South Africans | 99.9 /100 | #57 | Exceptional $50,044 |
| Immigrants | Malaysia | 99.9 /100 | #58 | Exceptional $49,983 |
| Bhutanese | 99.9 /100 | #59 | Exceptional $49,894 |
| Immigrants | Scotland | 99.9 /100 | #60 | Exceptional $49,893 |
| Argentineans | 99.9 /100 | #61 | Exceptional $49,862 |
Demographics Similar to Immigrants from Uruguay by Per Capita Income
In terms of per capita income, the demographic groups most similar to Immigrants from Uruguay are Immigrants from Philippines ($44,000, a difference of 0.010%), English ($43,982, a difference of 0.030%), Sri Lankan ($44,014, a difference of 0.040%), Belgian ($43,951, a difference of 0.10%), and Immigrants from South America ($44,068, a difference of 0.16%).
| Demographics | Rating | Rank | Per Capita Income |
| South Americans | 62.4 /100 | #159 | Good $44,114 |
| Danes | 61.9 /100 | #160 | Good $44,095 |
| Costa Ricans | 61.8 /100 | #161 | Good $44,090 |
| Swiss | 61.4 /100 | #162 | Good $44,076 |
| Immigrants | South America | 61.2 /100 | #163 | Good $44,068 |
| Sri Lankans | 59.8 /100 | #164 | Average $44,014 |
| Immigrants | Philippines | 59.4 /100 | #165 | Average $44,000 |
| Immigrants | Uruguay | 59.3 /100 | #166 | Average $43,997 |
| English | 58.9 /100 | #167 | Average $43,982 |
| Belgians | 58.1 /100 | #168 | Average $43,951 |
| Immigrants | Peru | 55.3 /100 | #169 | Average $43,852 |
| Scandinavians | 55.2 /100 | #170 | Average $43,848 |
| Immigrants | Eastern Africa | 54.9 /100 | #171 | Average $43,838 |
| Czechoslovakians | 54.1 /100 | #172 | Average $43,806 |
| French | 50.7 /100 | #173 | Average $43,685 |