Shoshone vs Immigrants from Afghanistan Median Female Earnings
COMPARE
Shoshone
Immigrants from Afghanistan
Median Female Earnings
Median Female Earnings Comparison
Shoshone
Immigrants from Afghanistan
$34,677
MEDIAN FEMALE EARNINGS
0.0/ 100
METRIC RATING
319th/ 347
METRIC RANK
$42,055
MEDIAN FEMALE EARNINGS
99.3/ 100
METRIC RATING
89th/ 347
METRIC RANK
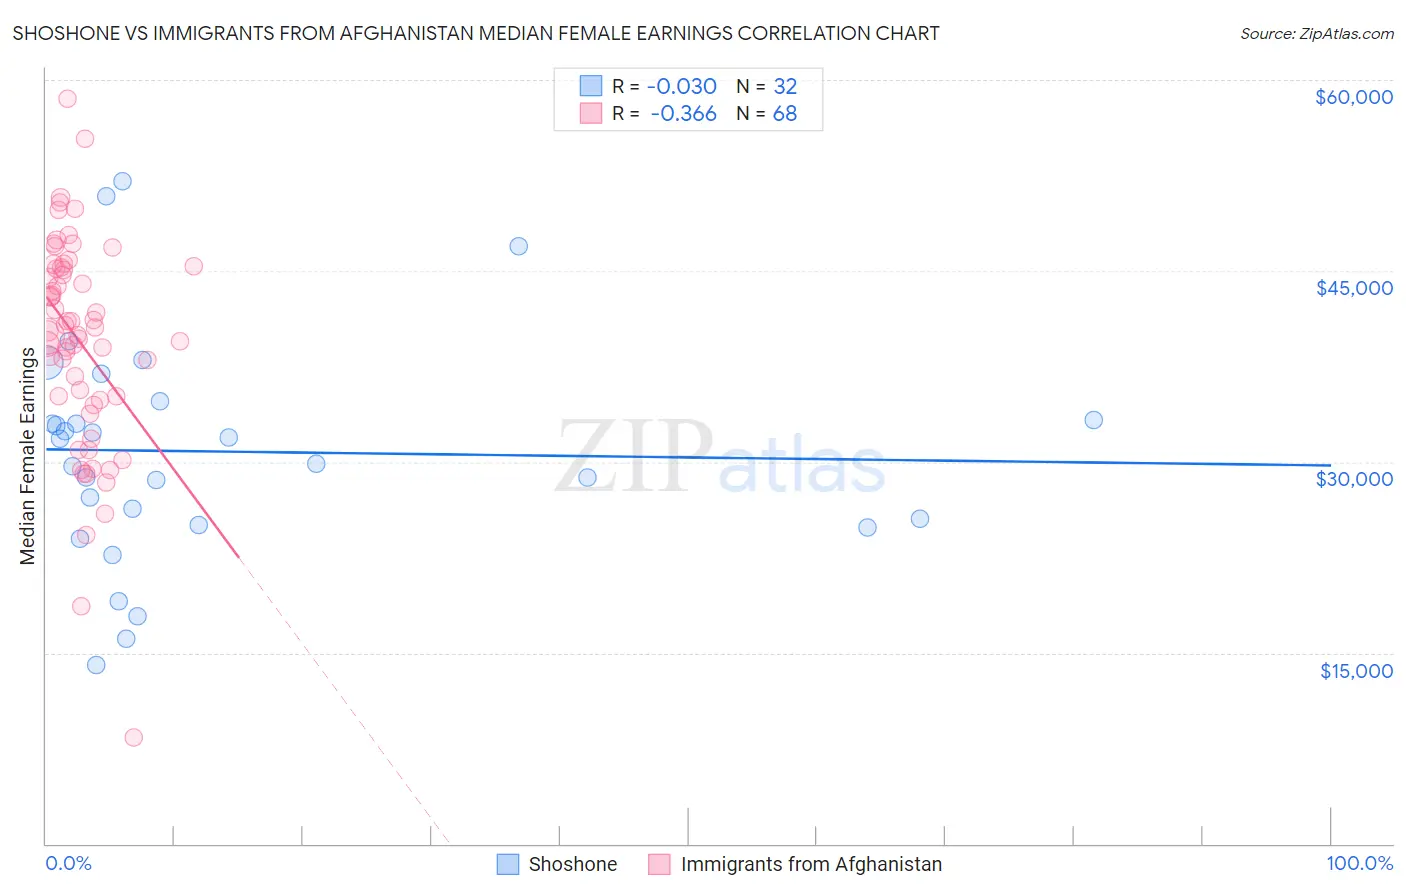
Shoshone vs Immigrants from Afghanistan Median Female Earnings Correlation Chart
The statistical analysis conducted on geographies consisting of 66,610,433 people shows no correlation between the proportion of Shoshone and median female earnings in the United States with a correlation coefficient (R) of -0.030 and weighted average of $34,677. Similarly, the statistical analysis conducted on geographies consisting of 147,640,622 people shows a mild negative correlation between the proportion of Immigrants from Afghanistan and median female earnings in the United States with a correlation coefficient (R) of -0.366 and weighted average of $42,055, a difference of 21.3%.
Median Female Earnings Correlation Summary
| Measurement | Shoshone | Immigrants from Afghanistan |
| Minimum | $14,091 | $8,380 |
| Maximum | $52,089 | $58,562 |
| Range | $37,998 | $50,182 |
| Mean | $30,807 | $39,466 |
| Median | $30,799 | $40,414 |
| Interquartile 25% (IQ1) | $25,287 | $34,989 |
| Interquartile 75% (IQ3) | $34,049 | $45,239 |
| Interquartile Range (IQR) | $8,762 | $10,250 |
| Standard Deviation (Sample) | $8,852 | $8,425 |
| Standard Deviation (Population) | $8,713 | $8,363 |
Similar Demographics by Median Female Earnings
Demographics Similar to Shoshone by Median Female Earnings
In terms of median female earnings, the demographic groups most similar to Shoshone are Immigrants from Yemen ($34,693, a difference of 0.050%), Immigrants from Honduras ($34,647, a difference of 0.090%), Potawatomi ($34,739, a difference of 0.18%), Cherokee ($34,742, a difference of 0.19%), and Pennsylvania German ($34,802, a difference of 0.36%).
| Demographics | Rating | Rank | Median Female Earnings |
| Yaqui | 0.0 /100 | #312 | Tragic $34,943 |
| Cubans | 0.0 /100 | #313 | Tragic $34,942 |
| Apache | 0.0 /100 | #314 | Tragic $34,895 |
| Pennsylvania Germans | 0.0 /100 | #315 | Tragic $34,802 |
| Cherokee | 0.0 /100 | #316 | Tragic $34,742 |
| Potawatomi | 0.0 /100 | #317 | Tragic $34,739 |
| Immigrants | Yemen | 0.0 /100 | #318 | Tragic $34,693 |
| Shoshone | 0.0 /100 | #319 | Tragic $34,677 |
| Immigrants | Honduras | 0.0 /100 | #320 | Tragic $34,647 |
| Hispanics or Latinos | 0.0 /100 | #321 | Tragic $34,421 |
| Chickasaw | 0.0 /100 | #322 | Tragic $34,414 |
| Seminole | 0.0 /100 | #323 | Tragic $34,385 |
| Immigrants | Congo | 0.0 /100 | #324 | Tragic $34,317 |
| Dutch West Indians | 0.0 /100 | #325 | Tragic $34,106 |
| Kiowa | 0.0 /100 | #326 | Tragic $34,074 |
Demographics Similar to Immigrants from Afghanistan by Median Female Earnings
In terms of median female earnings, the demographic groups most similar to Immigrants from Afghanistan are Immigrants from Northern Africa ($42,084, a difference of 0.070%), Ukrainian ($42,015, a difference of 0.10%), Lithuanian ($42,108, a difference of 0.12%), Immigrants from St. Vincent and the Grenadines ($42,108, a difference of 0.13%), and Immigrants from Western Europe ($41,990, a difference of 0.15%).
| Demographics | Rating | Rank | Median Female Earnings |
| Immigrants | Morocco | 99.5 /100 | #82 | Exceptional $42,229 |
| Immigrants | Sierra Leone | 99.5 /100 | #83 | Exceptional $42,214 |
| Armenians | 99.5 /100 | #84 | Exceptional $42,212 |
| Laotians | 99.4 /100 | #85 | Exceptional $42,133 |
| Immigrants | St. Vincent and the Grenadines | 99.3 /100 | #86 | Exceptional $42,108 |
| Lithuanians | 99.3 /100 | #87 | Exceptional $42,108 |
| Immigrants | Northern Africa | 99.3 /100 | #88 | Exceptional $42,084 |
| Immigrants | Afghanistan | 99.3 /100 | #89 | Exceptional $42,055 |
| Ukrainians | 99.2 /100 | #90 | Exceptional $42,015 |
| Immigrants | Western Europe | 99.2 /100 | #91 | Exceptional $41,990 |
| Argentineans | 99.1 /100 | #92 | Exceptional $41,952 |
| Immigrants | Grenada | 99.0 /100 | #93 | Exceptional $41,932 |
| Moroccans | 98.9 /100 | #94 | Exceptional $41,872 |
| Immigrants | Netherlands | 98.9 /100 | #95 | Exceptional $41,870 |
| South Africans | 98.8 /100 | #96 | Exceptional $41,825 |