Hmong vs Immigrants from Bahamas Median Male Earnings
COMPARE
Hmong
Immigrants from Bahamas
Median Male Earnings
Median Male Earnings Comparison
Hmong
Immigrants from Bahamas
$48,254
MEDIAN MALE EARNINGS
0.2/ 100
METRIC RATING
279th/ 347
METRIC RANK
$45,176
MEDIAN MALE EARNINGS
0.0/ 100
METRIC RATING
327th/ 347
METRIC RANK
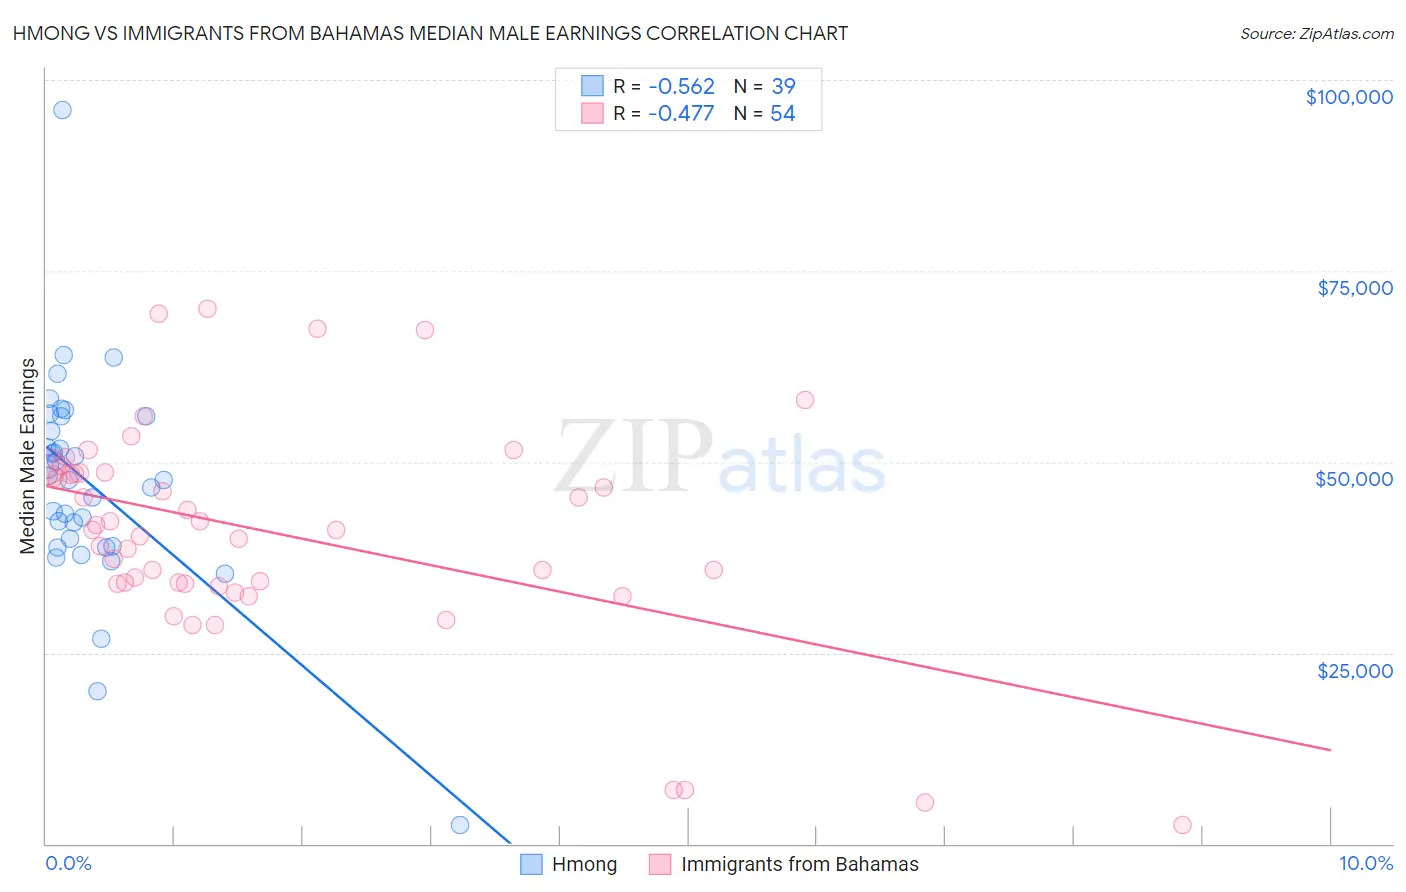
Hmong vs Immigrants from Bahamas Median Male Earnings Correlation Chart
The statistical analysis conducted on geographies consisting of 24,672,334 people shows a substantial negative correlation between the proportion of Hmong and median male earnings in the United States with a correlation coefficient (R) of -0.562 and weighted average of $48,254. Similarly, the statistical analysis conducted on geographies consisting of 104,652,587 people shows a moderate negative correlation between the proportion of Immigrants from Bahamas and median male earnings in the United States with a correlation coefficient (R) of -0.477 and weighted average of $45,176, a difference of 6.8%.
Median Male Earnings Correlation Summary
| Measurement | Hmong | Immigrants from Bahamas |
| Minimum | $2,499 | $2,499 |
| Maximum | $95,990 | $70,069 |
| Range | $93,491 | $67,570 |
| Mean | $47,121 | $40,703 |
| Median | $47,633 | $41,071 |
| Interquartile 25% (IQ1) | $38,872 | $34,087 |
| Interquartile 75% (IQ3) | $55,920 | $48,539 |
| Interquartile Range (IQR) | $17,048 | $14,452 |
| Standard Deviation (Sample) | $14,307 | $14,317 |
| Standard Deviation (Population) | $14,122 | $14,184 |
Similar Demographics by Median Male Earnings
Demographics Similar to Hmong by Median Male Earnings
In terms of median male earnings, the demographic groups most similar to Hmong are Comanche ($48,202, a difference of 0.11%), Immigrants from Liberia ($48,317, a difference of 0.13%), Belizean ($48,358, a difference of 0.22%), Marshallese ($48,137, a difference of 0.24%), and Blackfeet ($48,402, a difference of 0.31%).
| Demographics | Rating | Rank | Median Male Earnings |
| Salvadorans | 0.3 /100 | #272 | Tragic $48,646 |
| Jamaicans | 0.3 /100 | #273 | Tragic $48,632 |
| Colville | 0.3 /100 | #274 | Tragic $48,516 |
| Immigrants | Somalia | 0.3 /100 | #275 | Tragic $48,439 |
| Blackfeet | 0.3 /100 | #276 | Tragic $48,402 |
| Belizeans | 0.2 /100 | #277 | Tragic $48,358 |
| Immigrants | Liberia | 0.2 /100 | #278 | Tragic $48,317 |
| Hmong | 0.2 /100 | #279 | Tragic $48,254 |
| Comanche | 0.2 /100 | #280 | Tragic $48,202 |
| Marshallese | 0.2 /100 | #281 | Tragic $48,137 |
| Central Americans | 0.2 /100 | #282 | Tragic $48,093 |
| Immigrants | Jamaica | 0.2 /100 | #283 | Tragic $48,040 |
| Africans | 0.2 /100 | #284 | Tragic $47,994 |
| Paiute | 0.2 /100 | #285 | Tragic $47,991 |
| Mexican American Indians | 0.2 /100 | #286 | Tragic $47,990 |
Demographics Similar to Immigrants from Bahamas by Median Male Earnings
In terms of median male earnings, the demographic groups most similar to Immigrants from Bahamas are Kiowa ($45,094, a difference of 0.18%), Immigrants from Haiti ($45,266, a difference of 0.20%), Yakama ($45,002, a difference of 0.39%), Immigrants from Mexico ($44,960, a difference of 0.48%), and Yuman ($45,446, a difference of 0.60%).
| Demographics | Rating | Rank | Median Male Earnings |
| Immigrants | Honduras | 0.0 /100 | #320 | Tragic $45,787 |
| Fijians | 0.0 /100 | #321 | Tragic $45,607 |
| Sioux | 0.0 /100 | #322 | Tragic $45,566 |
| Immigrants | Central America | 0.0 /100 | #323 | Tragic $45,538 |
| Blacks/African Americans | 0.0 /100 | #324 | Tragic $45,523 |
| Yuman | 0.0 /100 | #325 | Tragic $45,446 |
| Immigrants | Haiti | 0.0 /100 | #326 | Tragic $45,266 |
| Immigrants | Bahamas | 0.0 /100 | #327 | Tragic $45,176 |
| Kiowa | 0.0 /100 | #328 | Tragic $45,094 |
| Yakama | 0.0 /100 | #329 | Tragic $45,002 |
| Immigrants | Mexico | 0.0 /100 | #330 | Tragic $44,960 |
| Natives/Alaskans | 0.0 /100 | #331 | Tragic $44,775 |
| Bahamians | 0.0 /100 | #332 | Tragic $44,756 |
| Immigrants | Congo | 0.0 /100 | #333 | Tragic $44,204 |
| Immigrants | Yemen | 0.0 /100 | #334 | Tragic $44,083 |