Hmong vs Nonimmigrants Median Male Earnings
COMPARE
Hmong
Nonimmigrants
Median Male Earnings
Median Male Earnings Comparison
Hmong
Nonimmigrants
$48,254
MEDIAN MALE EARNINGS
0.2/ 100
METRIC RATING
279th/ 347
METRIC RANK
$52,170
MEDIAN MALE EARNINGS
9.3/ 100
METRIC RATING
214th/ 347
METRIC RANK
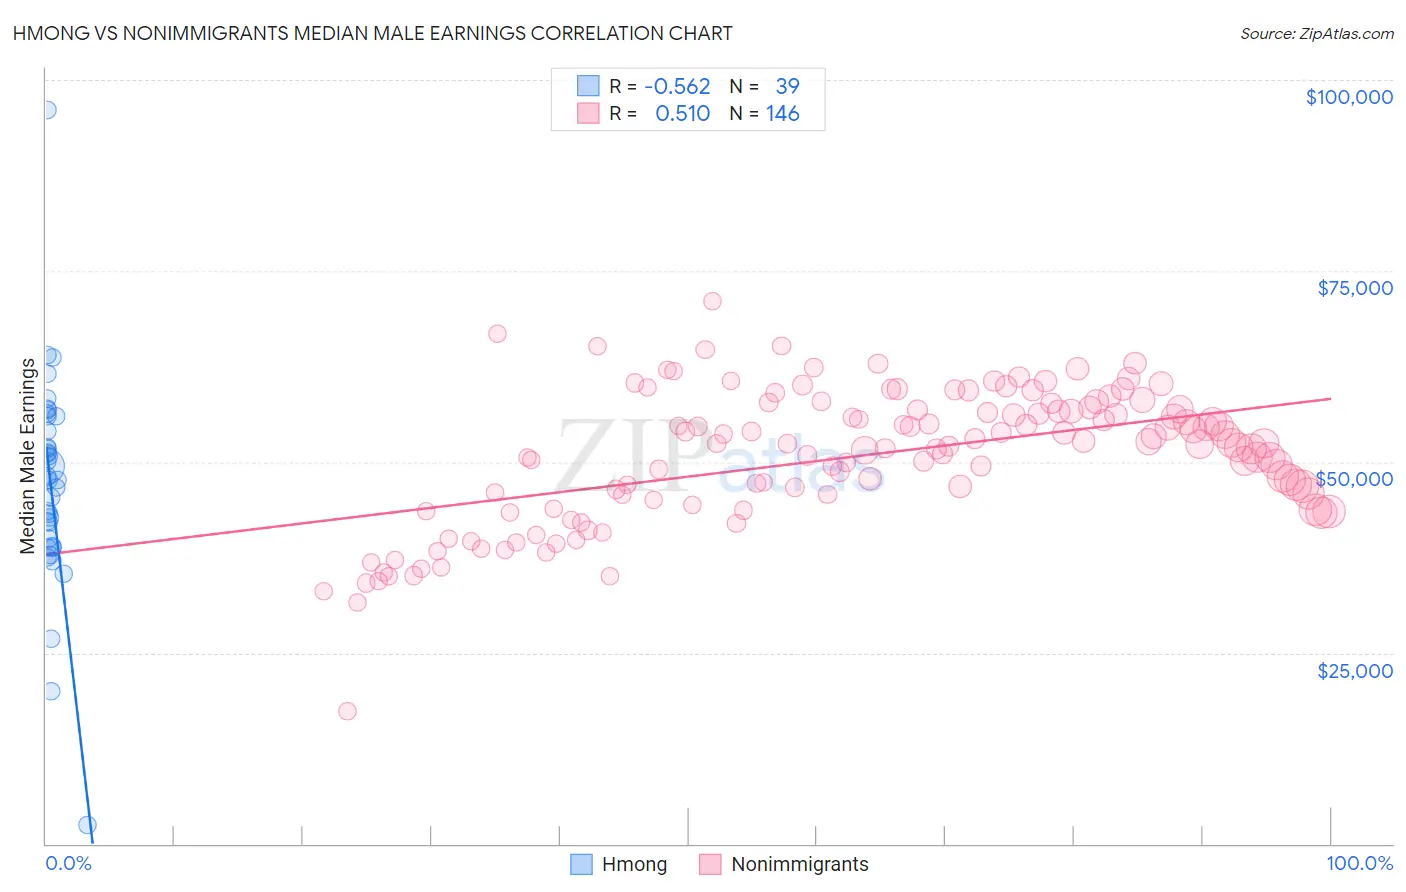
Hmong vs Nonimmigrants Median Male Earnings Correlation Chart
The statistical analysis conducted on geographies consisting of 24,672,334 people shows a substantial negative correlation between the proportion of Hmong and median male earnings in the United States with a correlation coefficient (R) of -0.562 and weighted average of $48,254. Similarly, the statistical analysis conducted on geographies consisting of 582,196,653 people shows a substantial positive correlation between the proportion of Nonimmigrants and median male earnings in the United States with a correlation coefficient (R) of 0.510 and weighted average of $52,170, a difference of 8.1%.
Median Male Earnings Correlation Summary
| Measurement | Hmong | Nonimmigrants |
| Minimum | $2,499 | $17,422 |
| Maximum | $95,990 | $71,068 |
| Range | $93,491 | $53,646 |
| Mean | $47,121 | $50,720 |
| Median | $47,633 | $52,345 |
| Interquartile 25% (IQ1) | $38,872 | $45,072 |
| Interquartile 75% (IQ3) | $55,920 | $56,800 |
| Interquartile Range (IQR) | $17,048 | $11,728 |
| Standard Deviation (Sample) | $14,307 | $8,752 |
| Standard Deviation (Population) | $14,122 | $8,722 |
Similar Demographics by Median Male Earnings
Demographics Similar to Hmong by Median Male Earnings
In terms of median male earnings, the demographic groups most similar to Hmong are Comanche ($48,202, a difference of 0.11%), Immigrants from Liberia ($48,317, a difference of 0.13%), Belizean ($48,358, a difference of 0.22%), Marshallese ($48,137, a difference of 0.24%), and Blackfeet ($48,402, a difference of 0.31%).
| Demographics | Rating | Rank | Median Male Earnings |
| Salvadorans | 0.3 /100 | #272 | Tragic $48,646 |
| Jamaicans | 0.3 /100 | #273 | Tragic $48,632 |
| Colville | 0.3 /100 | #274 | Tragic $48,516 |
| Immigrants | Somalia | 0.3 /100 | #275 | Tragic $48,439 |
| Blackfeet | 0.3 /100 | #276 | Tragic $48,402 |
| Belizeans | 0.2 /100 | #277 | Tragic $48,358 |
| Immigrants | Liberia | 0.2 /100 | #278 | Tragic $48,317 |
| Hmong | 0.2 /100 | #279 | Tragic $48,254 |
| Comanche | 0.2 /100 | #280 | Tragic $48,202 |
| Marshallese | 0.2 /100 | #281 | Tragic $48,137 |
| Central Americans | 0.2 /100 | #282 | Tragic $48,093 |
| Immigrants | Jamaica | 0.2 /100 | #283 | Tragic $48,040 |
| Africans | 0.2 /100 | #284 | Tragic $47,994 |
| Paiute | 0.2 /100 | #285 | Tragic $47,991 |
| Mexican American Indians | 0.2 /100 | #286 | Tragic $47,990 |
Demographics Similar to Nonimmigrants by Median Male Earnings
In terms of median male earnings, the demographic groups most similar to Nonimmigrants are Immigrants from Cameroon ($52,119, a difference of 0.10%), Immigrants from Venezuela ($52,041, a difference of 0.25%), Nigerian ($52,039, a difference of 0.25%), Native Hawaiian ($52,306, a difference of 0.26%), and Cajun ($52,325, a difference of 0.30%).
| Demographics | Rating | Rank | Median Male Earnings |
| Vietnamese | 12.7 /100 | #207 | Poor $52,525 |
| Venezuelans | 12.5 /100 | #208 | Poor $52,510 |
| Bermudans | 12.1 /100 | #209 | Poor $52,465 |
| Delaware | 11.5 /100 | #210 | Poor $52,412 |
| Tlingit-Haida | 11.5 /100 | #211 | Poor $52,409 |
| Cajuns | 10.7 /100 | #212 | Poor $52,325 |
| Native Hawaiians | 10.5 /100 | #213 | Poor $52,306 |
| Immigrants | Nonimmigrants | 9.3 /100 | #214 | Tragic $52,170 |
| Immigrants | Cameroon | 8.9 /100 | #215 | Tragic $52,119 |
| Immigrants | Venezuela | 8.3 /100 | #216 | Tragic $52,041 |
| Nigerians | 8.3 /100 | #217 | Tragic $52,039 |
| Immigrants | Panama | 7.7 /100 | #218 | Tragic $51,962 |
| Immigrants | Ghana | 6.9 /100 | #219 | Tragic $51,836 |
| Immigrants | Armenia | 6.6 /100 | #220 | Tragic $51,793 |
| Immigrants | Senegal | 5.8 /100 | #221 | Tragic $51,647 |