Hmong vs Lithuanian Median Male Earnings
COMPARE
Hmong
Lithuanian
Median Male Earnings
Median Male Earnings Comparison
Hmong
Lithuanians
$48,254
MEDIAN MALE EARNINGS
0.2/ 100
METRIC RATING
279th/ 347
METRIC RANK
$61,228
MEDIAN MALE EARNINGS
99.9/ 100
METRIC RATING
56th/ 347
METRIC RANK
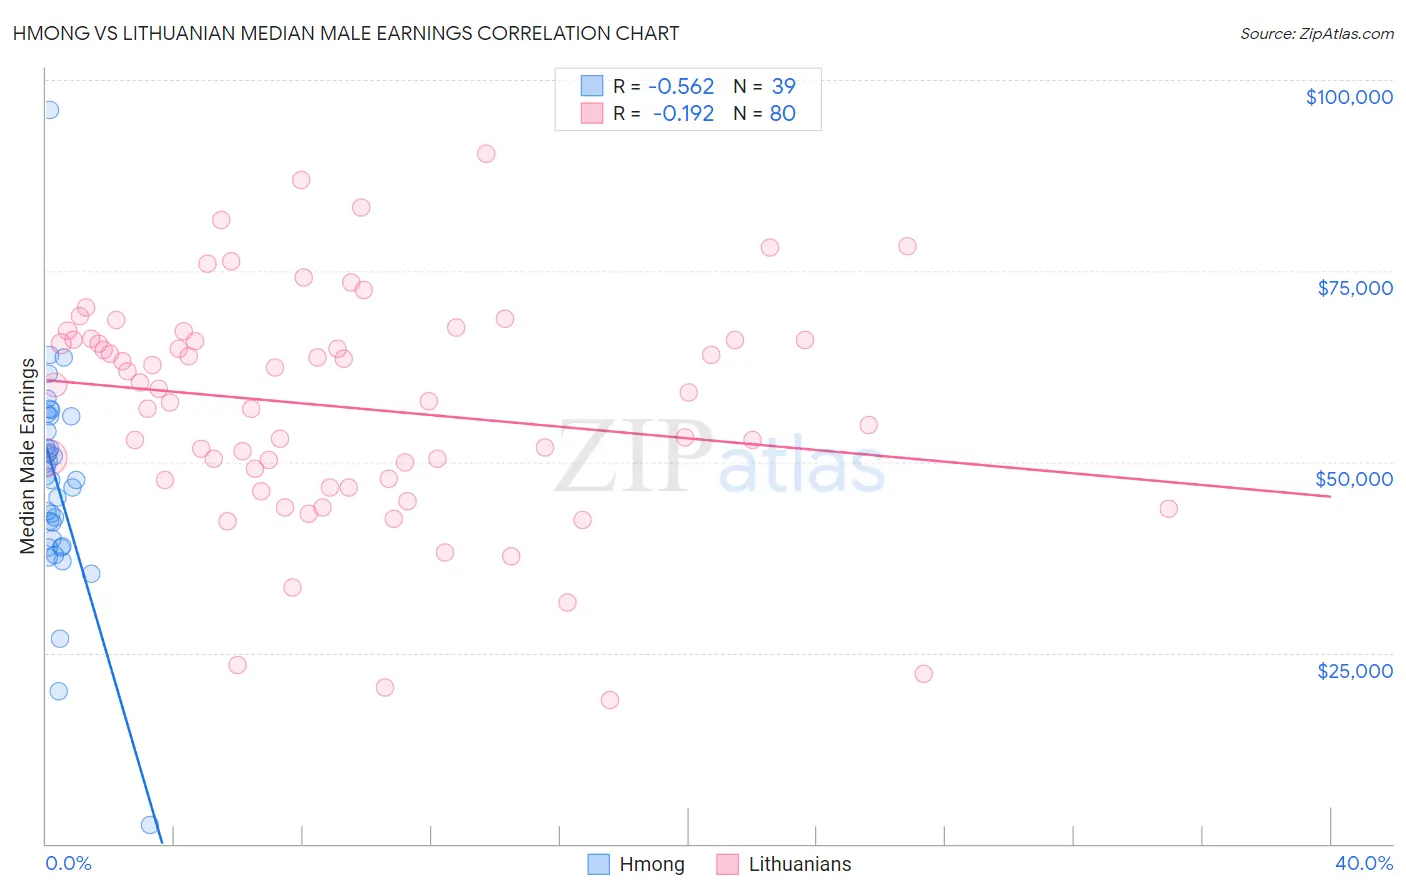
Hmong vs Lithuanian Median Male Earnings Correlation Chart
The statistical analysis conducted on geographies consisting of 24,672,334 people shows a substantial negative correlation between the proportion of Hmong and median male earnings in the United States with a correlation coefficient (R) of -0.562 and weighted average of $48,254. Similarly, the statistical analysis conducted on geographies consisting of 421,749,133 people shows a poor negative correlation between the proportion of Lithuanians and median male earnings in the United States with a correlation coefficient (R) of -0.192 and weighted average of $61,228, a difference of 26.9%.
Median Male Earnings Correlation Summary
| Measurement | Hmong | Lithuanian |
| Minimum | $2,499 | $18,839 |
| Maximum | $95,990 | $90,313 |
| Range | $93,491 | $71,474 |
| Mean | $47,121 | $57,160 |
| Median | $47,633 | $59,359 |
| Interquartile 25% (IQ1) | $38,872 | $47,714 |
| Interquartile 75% (IQ3) | $55,920 | $66,000 |
| Interquartile Range (IQR) | $17,048 | $18,286 |
| Standard Deviation (Sample) | $14,307 | $14,769 |
| Standard Deviation (Population) | $14,122 | $14,676 |
Similar Demographics by Median Male Earnings
Demographics Similar to Hmong by Median Male Earnings
In terms of median male earnings, the demographic groups most similar to Hmong are Comanche ($48,202, a difference of 0.11%), Immigrants from Liberia ($48,317, a difference of 0.13%), Belizean ($48,358, a difference of 0.22%), Marshallese ($48,137, a difference of 0.24%), and Blackfeet ($48,402, a difference of 0.31%).
| Demographics | Rating | Rank | Median Male Earnings |
| Salvadorans | 0.3 /100 | #272 | Tragic $48,646 |
| Jamaicans | 0.3 /100 | #273 | Tragic $48,632 |
| Colville | 0.3 /100 | #274 | Tragic $48,516 |
| Immigrants | Somalia | 0.3 /100 | #275 | Tragic $48,439 |
| Blackfeet | 0.3 /100 | #276 | Tragic $48,402 |
| Belizeans | 0.2 /100 | #277 | Tragic $48,358 |
| Immigrants | Liberia | 0.2 /100 | #278 | Tragic $48,317 |
| Hmong | 0.2 /100 | #279 | Tragic $48,254 |
| Comanche | 0.2 /100 | #280 | Tragic $48,202 |
| Marshallese | 0.2 /100 | #281 | Tragic $48,137 |
| Central Americans | 0.2 /100 | #282 | Tragic $48,093 |
| Immigrants | Jamaica | 0.2 /100 | #283 | Tragic $48,040 |
| Africans | 0.2 /100 | #284 | Tragic $47,994 |
| Paiute | 0.2 /100 | #285 | Tragic $47,991 |
| Mexican American Indians | 0.2 /100 | #286 | Tragic $47,990 |
Demographics Similar to Lithuanians by Median Male Earnings
In terms of median male earnings, the demographic groups most similar to Lithuanians are Immigrants from Scotland ($61,220, a difference of 0.010%), Greek ($61,242, a difference of 0.020%), New Zealander ($61,199, a difference of 0.050%), Immigrants from Netherlands ($61,096, a difference of 0.22%), and Egyptian ($61,095, a difference of 0.22%).
| Demographics | Rating | Rank | Median Male Earnings |
| Immigrants | Europe | 99.9 /100 | #49 | Exceptional $62,057 |
| Bhutanese | 99.9 /100 | #50 | Exceptional $61,759 |
| Estonians | 99.9 /100 | #51 | Exceptional $61,710 |
| Immigrants | Norway | 99.9 /100 | #52 | Exceptional $61,628 |
| South Africans | 99.9 /100 | #53 | Exceptional $61,460 |
| Immigrants | Latvia | 99.9 /100 | #54 | Exceptional $61,422 |
| Greeks | 99.9 /100 | #55 | Exceptional $61,242 |
| Lithuanians | 99.9 /100 | #56 | Exceptional $61,228 |
| Immigrants | Scotland | 99.9 /100 | #57 | Exceptional $61,220 |
| New Zealanders | 99.9 /100 | #58 | Exceptional $61,199 |
| Immigrants | Netherlands | 99.8 /100 | #59 | Exceptional $61,096 |
| Egyptians | 99.8 /100 | #60 | Exceptional $61,095 |
| Bolivians | 99.8 /100 | #61 | Exceptional $61,066 |
| Immigrants | Romania | 99.8 /100 | #62 | Exceptional $61,040 |
| Immigrants | Pakistan | 99.8 /100 | #63 | Exceptional $60,987 |