Hispanic or Latino vs Asian Unemployment
COMPARE
Hispanic or Latino
Asian
Unemployment
Unemployment Comparison
Hispanics or Latinos
Asians
5.9%
UNEMPLOYMENT
0.0/ 100
METRIC RATING
272nd/ 347
METRIC RANK
5.1%
UNEMPLOYMENT
89.0/ 100
METRIC RATING
123rd/ 347
METRIC RANK
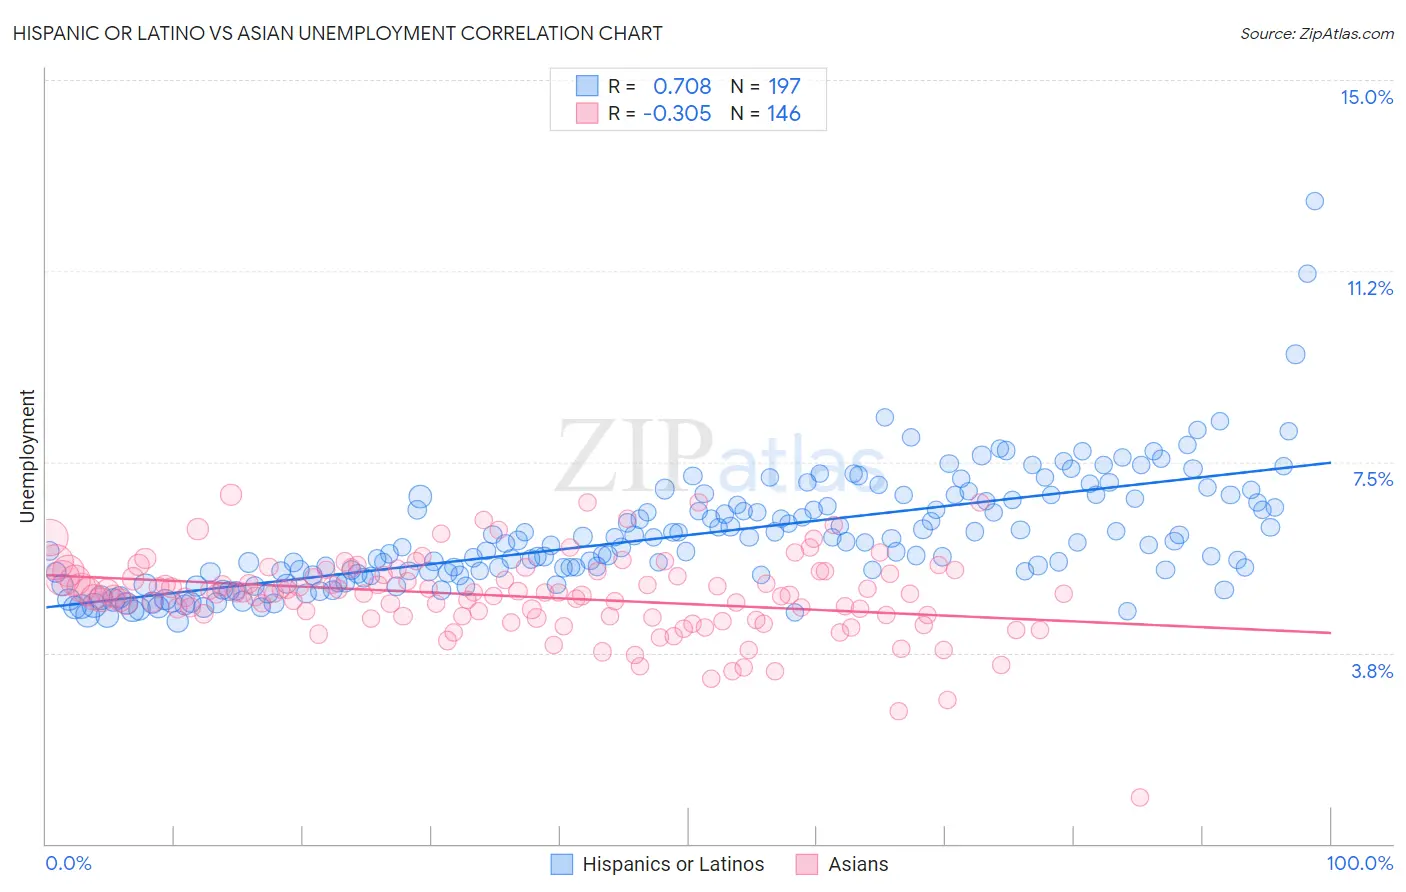
Hispanic or Latino vs Asian Unemployment Correlation Chart
The statistical analysis conducted on geographies consisting of 570,210,949 people shows a strong positive correlation between the proportion of Hispanics or Latinos and unemployment in the United States with a correlation coefficient (R) of 0.708 and weighted average of 5.9%. Similarly, the statistical analysis conducted on geographies consisting of 548,726,381 people shows a mild negative correlation between the proportion of Asians and unemployment in the United States with a correlation coefficient (R) of -0.305 and weighted average of 5.1%, a difference of 15.9%.
Unemployment Correlation Summary
| Measurement | Hispanic or Latino | Asian |
| Minimum | 4.4% | 0.90% |
| Maximum | 12.6% | 6.9% |
| Range | 8.3% | 6.0% |
| Mean | 6.0% | 4.9% |
| Median | 5.9% | 4.9% |
| Interquartile 25% (IQ1) | 5.3% | 4.5% |
| Interquartile 75% (IQ3) | 6.7% | 5.3% |
| Interquartile Range (IQR) | 1.4% | 0.84% |
| Standard Deviation (Sample) | 1.1% | 0.81% |
| Standard Deviation (Population) | 1.1% | 0.81% |
Similar Demographics by Unemployment
Demographics Similar to Hispanics or Latinos by Unemployment
In terms of unemployment, the demographic groups most similar to Hispanics or Latinos are Immigrants from Fiji (5.9%, a difference of 0.17%), Bahamian (5.9%, a difference of 0.46%), Immigrants from Latin America (5.9%, a difference of 0.67%), Mexican (5.9%, a difference of 0.68%), and Blackfeet (5.8%, a difference of 0.92%).
| Demographics | Rating | Rank | Unemployment |
| Nigerians | 0.1 /100 | #265 | Tragic 5.8% |
| Mexican American Indians | 0.1 /100 | #266 | Tragic 5.8% |
| Immigrants | Nigeria | 0.1 /100 | #267 | Tragic 5.8% |
| Immigrants | Sierra Leone | 0.1 /100 | #268 | Tragic 5.8% |
| Immigrants | El Salvador | 0.1 /100 | #269 | Tragic 5.8% |
| Blackfeet | 0.1 /100 | #270 | Tragic 5.8% |
| Mexicans | 0.1 /100 | #271 | Tragic 5.9% |
| Hispanics or Latinos | 0.0 /100 | #272 | Tragic 5.9% |
| Immigrants | Fiji | 0.0 /100 | #273 | Tragic 5.9% |
| Bahamians | 0.0 /100 | #274 | Tragic 5.9% |
| Immigrants | Latin America | 0.0 /100 | #275 | Tragic 5.9% |
| Immigrants | Central America | 0.0 /100 | #276 | Tragic 6.0% |
| Armenians | 0.0 /100 | #277 | Tragic 6.0% |
| Ghanaians | 0.0 /100 | #278 | Tragic 6.0% |
| Immigrants | Mexico | 0.0 /100 | #279 | Tragic 6.0% |
Demographics Similar to Asians by Unemployment
In terms of unemployment, the demographic groups most similar to Asians are Immigrants from Switzerland (5.1%, a difference of 0.020%), Lebanese (5.1%, a difference of 0.040%), Ethiopian (5.1%, a difference of 0.050%), Immigrants from Eastern Asia (5.1%, a difference of 0.10%), and Macedonian (5.1%, a difference of 0.11%).
| Demographics | Rating | Rank | Unemployment |
| Immigrants | Sri Lanka | 91.1 /100 | #116 | Exceptional 5.1% |
| Immigrants | Malaysia | 91.0 /100 | #117 | Exceptional 5.1% |
| Immigrants | Germany | 90.8 /100 | #118 | Exceptional 5.1% |
| Immigrants | France | 89.7 /100 | #119 | Excellent 5.1% |
| Macedonians | 89.7 /100 | #120 | Excellent 5.1% |
| Lebanese | 89.2 /100 | #121 | Excellent 5.1% |
| Immigrants | Switzerland | 89.1 /100 | #122 | Excellent 5.1% |
| Asians | 89.0 /100 | #123 | Excellent 5.1% |
| Ethiopians | 88.6 /100 | #124 | Excellent 5.1% |
| Immigrants | Eastern Asia | 88.3 /100 | #125 | Excellent 5.1% |
| Kenyans | 88.2 /100 | #126 | Excellent 5.1% |
| Immigrants | Kenya | 88.2 /100 | #127 | Excellent 5.1% |
| Immigrants | Eastern Africa | 88.1 /100 | #128 | Excellent 5.1% |
| Immigrants | Latvia | 88.0 /100 | #129 | Excellent 5.1% |
| Iranians | 86.9 /100 | #130 | Excellent 5.1% |