Iraqi vs Asian Median Earnings
COMPARE
Iraqi
Asian
Median Earnings
Median Earnings Comparison
Iraqis
Asians
$46,140
MEDIAN EARNINGS
39.9/ 100
METRIC RATING
187th/ 347
METRIC RANK
$53,690
MEDIAN EARNINGS
100.0/ 100
METRIC RATING
27th/ 347
METRIC RANK
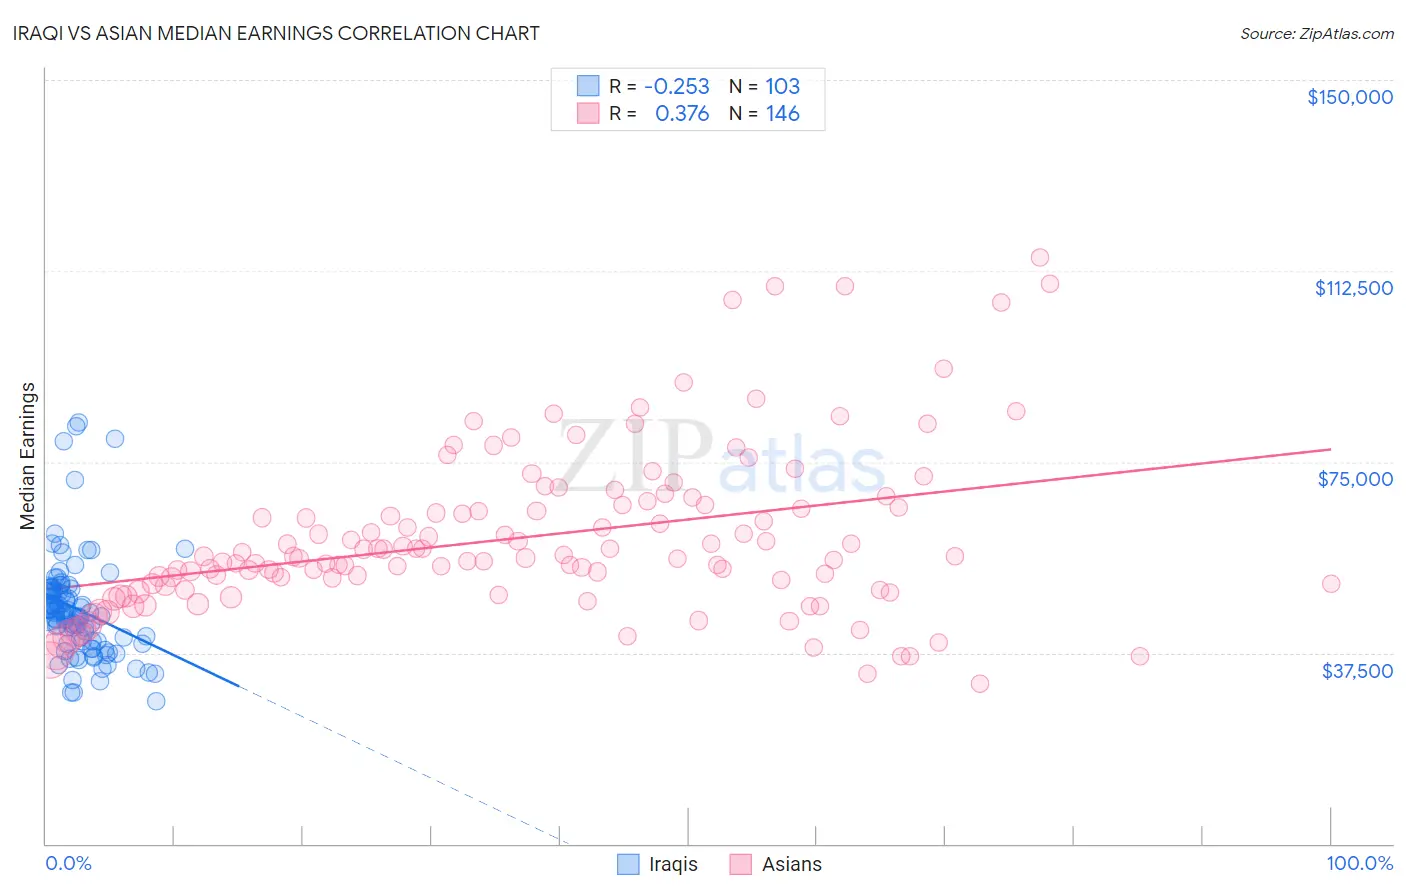
Iraqi vs Asian Median Earnings Correlation Chart
The statistical analysis conducted on geographies consisting of 170,634,576 people shows a weak negative correlation between the proportion of Iraqis and median earnings in the United States with a correlation coefficient (R) of -0.253 and weighted average of $46,140. Similarly, the statistical analysis conducted on geographies consisting of 550,727,448 people shows a mild positive correlation between the proportion of Asians and median earnings in the United States with a correlation coefficient (R) of 0.376 and weighted average of $53,690, a difference of 16.4%.
Median Earnings Correlation Summary
| Measurement | Iraqi | Asian |
| Minimum | $27,932 | $31,416 |
| Maximum | $82,727 | $115,028 |
| Range | $54,795 | $83,612 |
| Mean | $46,064 | $60,136 |
| Median | $45,313 | $56,241 |
| Interquartile 25% (IQ1) | $39,685 | $50,602 |
| Interquartile 75% (IQ3) | $49,745 | $66,425 |
| Interquartile Range (IQR) | $10,060 | $15,823 |
| Standard Deviation (Sample) | $10,188 | $16,173 |
| Standard Deviation (Population) | $10,138 | $16,117 |
Similar Demographics by Median Earnings
Demographics Similar to Iraqis by Median Earnings
In terms of median earnings, the demographic groups most similar to Iraqis are Vietnamese ($46,172, a difference of 0.070%), Immigrants from Armenia ($46,094, a difference of 0.10%), Uruguayan ($46,190, a difference of 0.11%), Immigrants from Kenya ($46,214, a difference of 0.16%), and Spaniard ($46,059, a difference of 0.18%).
| Demographics | Rating | Rank | Median Earnings |
| Puget Sound Salish | 46.5 /100 | #180 | Average $46,333 |
| Immigrants | Cameroon | 46.4 /100 | #181 | Average $46,329 |
| Swiss | 45.9 /100 | #182 | Average $46,315 |
| French | 45.2 /100 | #183 | Average $46,296 |
| Immigrants | Kenya | 42.4 /100 | #184 | Average $46,214 |
| Uruguayans | 41.6 /100 | #185 | Average $46,190 |
| Vietnamese | 40.9 /100 | #186 | Average $46,172 |
| Iraqis | 39.9 /100 | #187 | Fair $46,140 |
| Immigrants | Armenia | 38.3 /100 | #188 | Fair $46,094 |
| Spaniards | 37.2 /100 | #189 | Fair $46,059 |
| French Canadians | 36.1 /100 | #190 | Fair $46,026 |
| Finns | 33.4 /100 | #191 | Fair $45,940 |
| Germans | 33.2 /100 | #192 | Fair $45,935 |
| Guamanians/Chamorros | 33.2 /100 | #193 | Fair $45,933 |
| Immigrants | Costa Rica | 33.0 /100 | #194 | Fair $45,928 |
Demographics Similar to Asians by Median Earnings
In terms of median earnings, the demographic groups most similar to Asians are Immigrants from Northern Europe ($53,872, a difference of 0.34%), Immigrants from France ($53,490, a difference of 0.37%), Turkish ($53,919, a difference of 0.43%), Immigrants from Russia ($53,457, a difference of 0.43%), and Cambodian ($53,386, a difference of 0.57%).
| Demographics | Rating | Rank | Median Earnings |
| Cypriots | 100.0 /100 | #20 | Exceptional $54,589 |
| Burmese | 100.0 /100 | #21 | Exceptional $54,559 |
| Immigrants | Korea | 100.0 /100 | #22 | Exceptional $54,530 |
| Immigrants | Sweden | 100.0 /100 | #23 | Exceptional $54,478 |
| Soviet Union | 100.0 /100 | #24 | Exceptional $54,290 |
| Turks | 100.0 /100 | #25 | Exceptional $53,919 |
| Immigrants | Northern Europe | 100.0 /100 | #26 | Exceptional $53,872 |
| Asians | 100.0 /100 | #27 | Exceptional $53,690 |
| Immigrants | France | 100.0 /100 | #28 | Exceptional $53,490 |
| Immigrants | Russia | 100.0 /100 | #29 | Exceptional $53,457 |
| Cambodians | 100.0 /100 | #30 | Exceptional $53,386 |
| Russians | 100.0 /100 | #31 | Exceptional $53,334 |
| Immigrants | Asia | 100.0 /100 | #32 | Exceptional $53,310 |
| Immigrants | Greece | 100.0 /100 | #33 | Exceptional $53,282 |
| Immigrants | Sri Lanka | 100.0 /100 | #34 | Exceptional $53,268 |