Croatian vs Asian Median Earnings
COMPARE
Croatian
Asian
Median Earnings
Median Earnings Comparison
Croatians
Asians
$49,724
MEDIAN EARNINGS
99.0/ 100
METRIC RATING
94th/ 347
METRIC RANK
$53,690
MEDIAN EARNINGS
100.0/ 100
METRIC RATING
27th/ 347
METRIC RANK
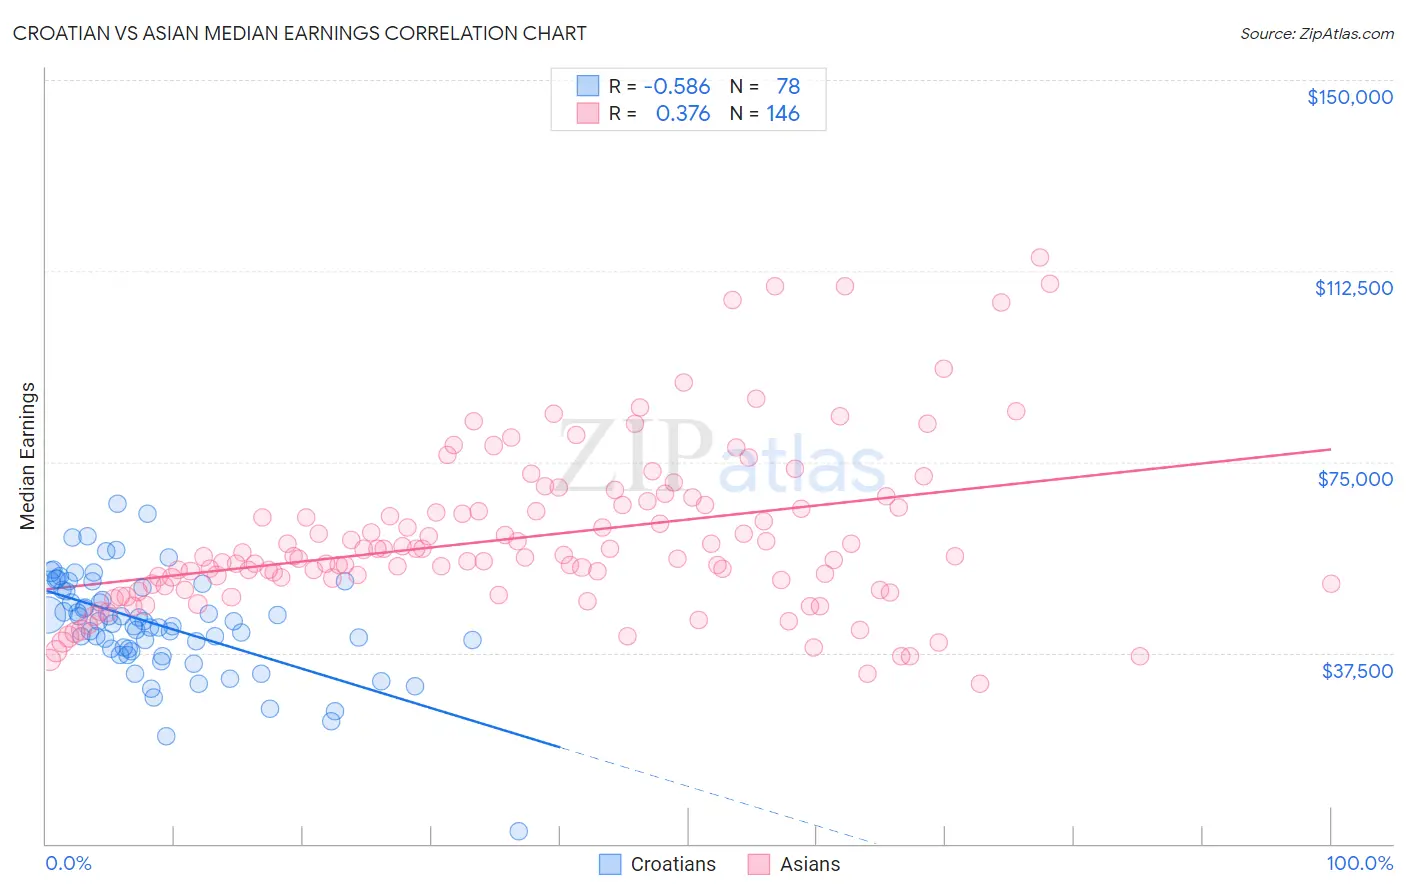
Croatian vs Asian Median Earnings Correlation Chart
The statistical analysis conducted on geographies consisting of 375,721,737 people shows a substantial negative correlation between the proportion of Croatians and median earnings in the United States with a correlation coefficient (R) of -0.586 and weighted average of $49,724. Similarly, the statistical analysis conducted on geographies consisting of 550,727,448 people shows a mild positive correlation between the proportion of Asians and median earnings in the United States with a correlation coefficient (R) of 0.376 and weighted average of $53,690, a difference of 8.0%.
Median Earnings Correlation Summary
| Measurement | Croatian | Asian |
| Minimum | $2,499 | $31,416 |
| Maximum | $66,786 | $115,028 |
| Range | $64,287 | $83,612 |
| Mean | $43,106 | $60,136 |
| Median | $43,408 | $56,241 |
| Interquartile 25% (IQ1) | $38,221 | $50,602 |
| Interquartile 75% (IQ3) | $50,378 | $66,425 |
| Interquartile Range (IQR) | $12,158 | $15,823 |
| Standard Deviation (Sample) | $10,203 | $16,173 |
| Standard Deviation (Population) | $10,137 | $16,117 |
Similar Demographics by Median Earnings
Demographics Similar to Croatians by Median Earnings
In terms of median earnings, the demographic groups most similar to Croatians are Immigrants from England ($49,722, a difference of 0.0%), Immigrants from Lebanon ($49,682, a difference of 0.090%), Immigrants from North Macedonia ($49,658, a difference of 0.13%), Immigrants from Northern Africa ($49,648, a difference of 0.15%), and Armenian ($49,804, a difference of 0.16%).
| Demographics | Rating | Rank | Median Earnings |
| Immigrants | Uzbekistan | 99.5 /100 | #87 | Exceptional $50,151 |
| Albanians | 99.4 /100 | #88 | Exceptional $50,116 |
| Immigrants | North America | 99.4 /100 | #89 | Exceptional $50,108 |
| Italians | 99.3 /100 | #90 | Exceptional $49,915 |
| Macedonians | 99.2 /100 | #91 | Exceptional $49,893 |
| Immigrants | Argentina | 99.2 /100 | #92 | Exceptional $49,841 |
| Armenians | 99.1 /100 | #93 | Exceptional $49,804 |
| Croatians | 99.0 /100 | #94 | Exceptional $49,724 |
| Immigrants | England | 99.0 /100 | #95 | Exceptional $49,722 |
| Immigrants | Lebanon | 99.0 /100 | #96 | Exceptional $49,682 |
| Immigrants | North Macedonia | 98.9 /100 | #97 | Exceptional $49,658 |
| Immigrants | Northern Africa | 98.9 /100 | #98 | Exceptional $49,648 |
| Immigrants | Afghanistan | 98.9 /100 | #99 | Exceptional $49,645 |
| Immigrants | Poland | 98.9 /100 | #100 | Exceptional $49,633 |
| Jordanians | 98.9 /100 | #101 | Exceptional $49,632 |
Demographics Similar to Asians by Median Earnings
In terms of median earnings, the demographic groups most similar to Asians are Immigrants from Northern Europe ($53,872, a difference of 0.34%), Immigrants from France ($53,490, a difference of 0.37%), Turkish ($53,919, a difference of 0.43%), Immigrants from Russia ($53,457, a difference of 0.43%), and Cambodian ($53,386, a difference of 0.57%).
| Demographics | Rating | Rank | Median Earnings |
| Cypriots | 100.0 /100 | #20 | Exceptional $54,589 |
| Burmese | 100.0 /100 | #21 | Exceptional $54,559 |
| Immigrants | Korea | 100.0 /100 | #22 | Exceptional $54,530 |
| Immigrants | Sweden | 100.0 /100 | #23 | Exceptional $54,478 |
| Soviet Union | 100.0 /100 | #24 | Exceptional $54,290 |
| Turks | 100.0 /100 | #25 | Exceptional $53,919 |
| Immigrants | Northern Europe | 100.0 /100 | #26 | Exceptional $53,872 |
| Asians | 100.0 /100 | #27 | Exceptional $53,690 |
| Immigrants | France | 100.0 /100 | #28 | Exceptional $53,490 |
| Immigrants | Russia | 100.0 /100 | #29 | Exceptional $53,457 |
| Cambodians | 100.0 /100 | #30 | Exceptional $53,386 |
| Russians | 100.0 /100 | #31 | Exceptional $53,334 |
| Immigrants | Asia | 100.0 /100 | #32 | Exceptional $53,310 |
| Immigrants | Greece | 100.0 /100 | #33 | Exceptional $53,282 |
| Immigrants | Sri Lanka | 100.0 /100 | #34 | Exceptional $53,268 |