Immigrants from Jordan vs Asian Median Earnings
COMPARE
Immigrants from Jordan
Asian
Median Earnings
Median Earnings Comparison
Immigrants from Jordan
Asians
$48,673
MEDIAN EARNINGS
95.9/ 100
METRIC RATING
118th/ 347
METRIC RANK
$53,690
MEDIAN EARNINGS
100.0/ 100
METRIC RATING
27th/ 347
METRIC RANK
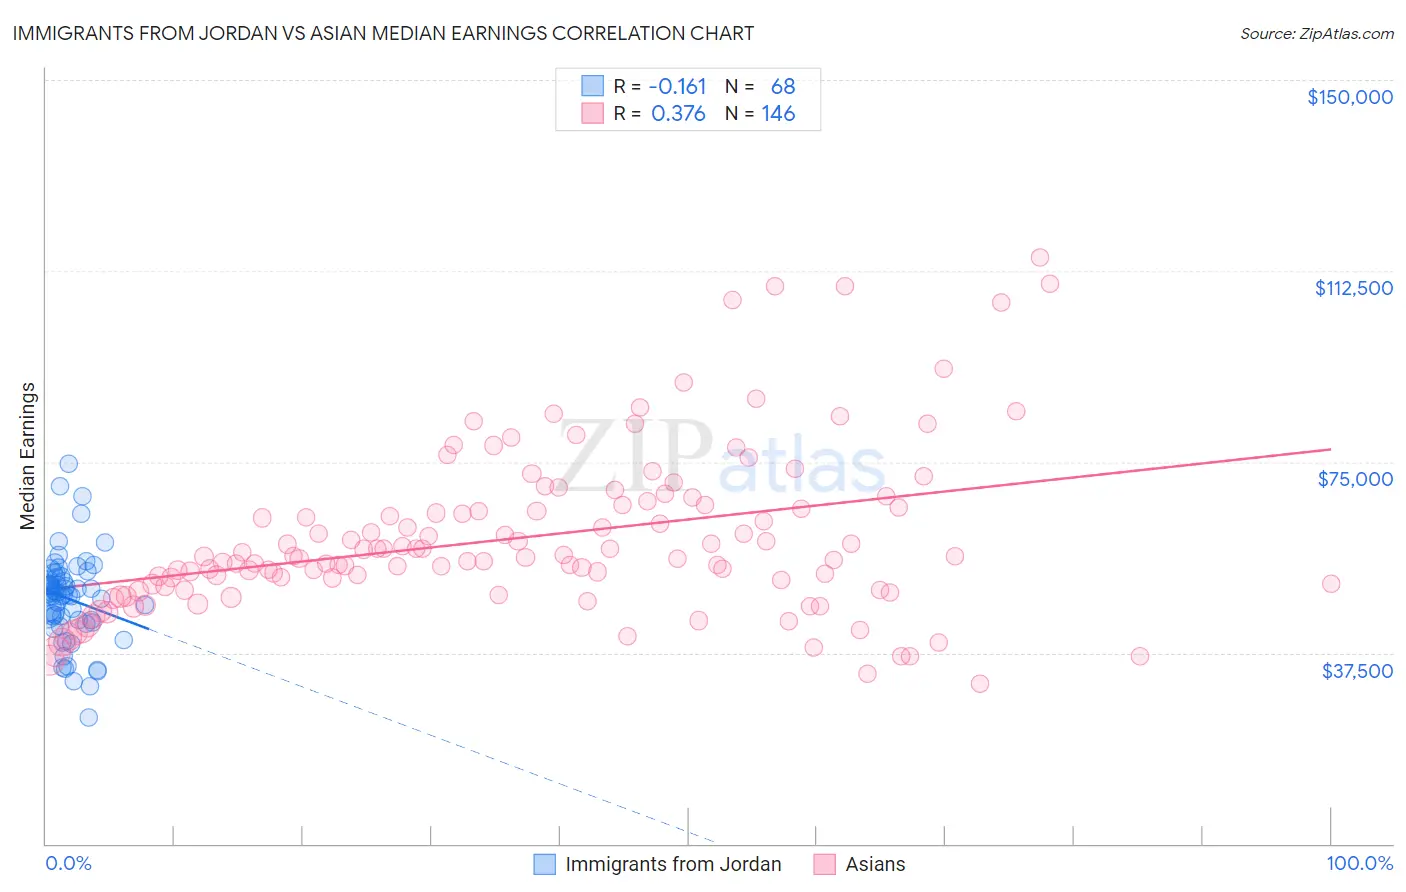
Immigrants from Jordan vs Asian Median Earnings Correlation Chart
The statistical analysis conducted on geographies consisting of 181,245,350 people shows a poor negative correlation between the proportion of Immigrants from Jordan and median earnings in the United States with a correlation coefficient (R) of -0.161 and weighted average of $48,673. Similarly, the statistical analysis conducted on geographies consisting of 550,727,448 people shows a mild positive correlation between the proportion of Asians and median earnings in the United States with a correlation coefficient (R) of 0.376 and weighted average of $53,690, a difference of 10.3%.
Median Earnings Correlation Summary
| Measurement | Immigrants from Jordan | Asian |
| Minimum | $24,779 | $31,416 |
| Maximum | $74,707 | $115,028 |
| Range | $49,928 | $83,612 |
| Mean | $48,083 | $60,136 |
| Median | $48,848 | $56,241 |
| Interquartile 25% (IQ1) | $43,626 | $50,602 |
| Interquartile 75% (IQ3) | $52,401 | $66,425 |
| Interquartile Range (IQR) | $8,775 | $15,823 |
| Standard Deviation (Sample) | $8,922 | $16,173 |
| Standard Deviation (Population) | $8,857 | $16,117 |
Similar Demographics by Median Earnings
Demographics Similar to Immigrants from Jordan by Median Earnings
In terms of median earnings, the demographic groups most similar to Immigrants from Jordan are Serbian ($48,677, a difference of 0.010%), Polish ($48,659, a difference of 0.030%), Korean ($48,727, a difference of 0.11%), Carpatho Rusyn ($48,617, a difference of 0.11%), and Arab ($48,599, a difference of 0.15%).
| Demographics | Rating | Rank | Median Earnings |
| Immigrants | Zimbabwe | 97.0 /100 | #111 | Exceptional $48,913 |
| Northern Europeans | 96.9 /100 | #112 | Exceptional $48,887 |
| Immigrants | Kuwait | 96.8 /100 | #113 | Exceptional $48,861 |
| Moroccans | 96.7 /100 | #114 | Exceptional $48,838 |
| Chinese | 96.7 /100 | #115 | Exceptional $48,836 |
| Koreans | 96.2 /100 | #116 | Exceptional $48,727 |
| Serbians | 95.9 /100 | #117 | Exceptional $48,677 |
| Immigrants | Jordan | 95.9 /100 | #118 | Exceptional $48,673 |
| Poles | 95.8 /100 | #119 | Exceptional $48,659 |
| Carpatho Rusyns | 95.5 /100 | #120 | Exceptional $48,617 |
| Arabs | 95.4 /100 | #121 | Exceptional $48,599 |
| Chileans | 94.8 /100 | #122 | Exceptional $48,504 |
| Immigrants | Syria | 93.9 /100 | #123 | Exceptional $48,375 |
| Brazilians | 93.7 /100 | #124 | Exceptional $48,356 |
| Immigrants | Fiji | 93.3 /100 | #125 | Exceptional $48,305 |
Demographics Similar to Asians by Median Earnings
In terms of median earnings, the demographic groups most similar to Asians are Immigrants from Northern Europe ($53,872, a difference of 0.34%), Immigrants from France ($53,490, a difference of 0.37%), Turkish ($53,919, a difference of 0.43%), Immigrants from Russia ($53,457, a difference of 0.43%), and Cambodian ($53,386, a difference of 0.57%).
| Demographics | Rating | Rank | Median Earnings |
| Cypriots | 100.0 /100 | #20 | Exceptional $54,589 |
| Burmese | 100.0 /100 | #21 | Exceptional $54,559 |
| Immigrants | Korea | 100.0 /100 | #22 | Exceptional $54,530 |
| Immigrants | Sweden | 100.0 /100 | #23 | Exceptional $54,478 |
| Soviet Union | 100.0 /100 | #24 | Exceptional $54,290 |
| Turks | 100.0 /100 | #25 | Exceptional $53,919 |
| Immigrants | Northern Europe | 100.0 /100 | #26 | Exceptional $53,872 |
| Asians | 100.0 /100 | #27 | Exceptional $53,690 |
| Immigrants | France | 100.0 /100 | #28 | Exceptional $53,490 |
| Immigrants | Russia | 100.0 /100 | #29 | Exceptional $53,457 |
| Cambodians | 100.0 /100 | #30 | Exceptional $53,386 |
| Russians | 100.0 /100 | #31 | Exceptional $53,334 |
| Immigrants | Asia | 100.0 /100 | #32 | Exceptional $53,310 |
| Immigrants | Greece | 100.0 /100 | #33 | Exceptional $53,282 |
| Immigrants | Sri Lanka | 100.0 /100 | #34 | Exceptional $53,268 |