Haitian vs West Indian Per Capita Income
COMPARE
Haitian
West Indian
Per Capita Income
Per Capita Income Comparison
Haitians
West Indians
$37,289
PER CAPITA INCOME
0.1/ 100
METRIC RATING
297th/ 347
METRIC RANK
$41,217
PER CAPITA INCOME
6.0/ 100
METRIC RATING
225th/ 347
METRIC RANK
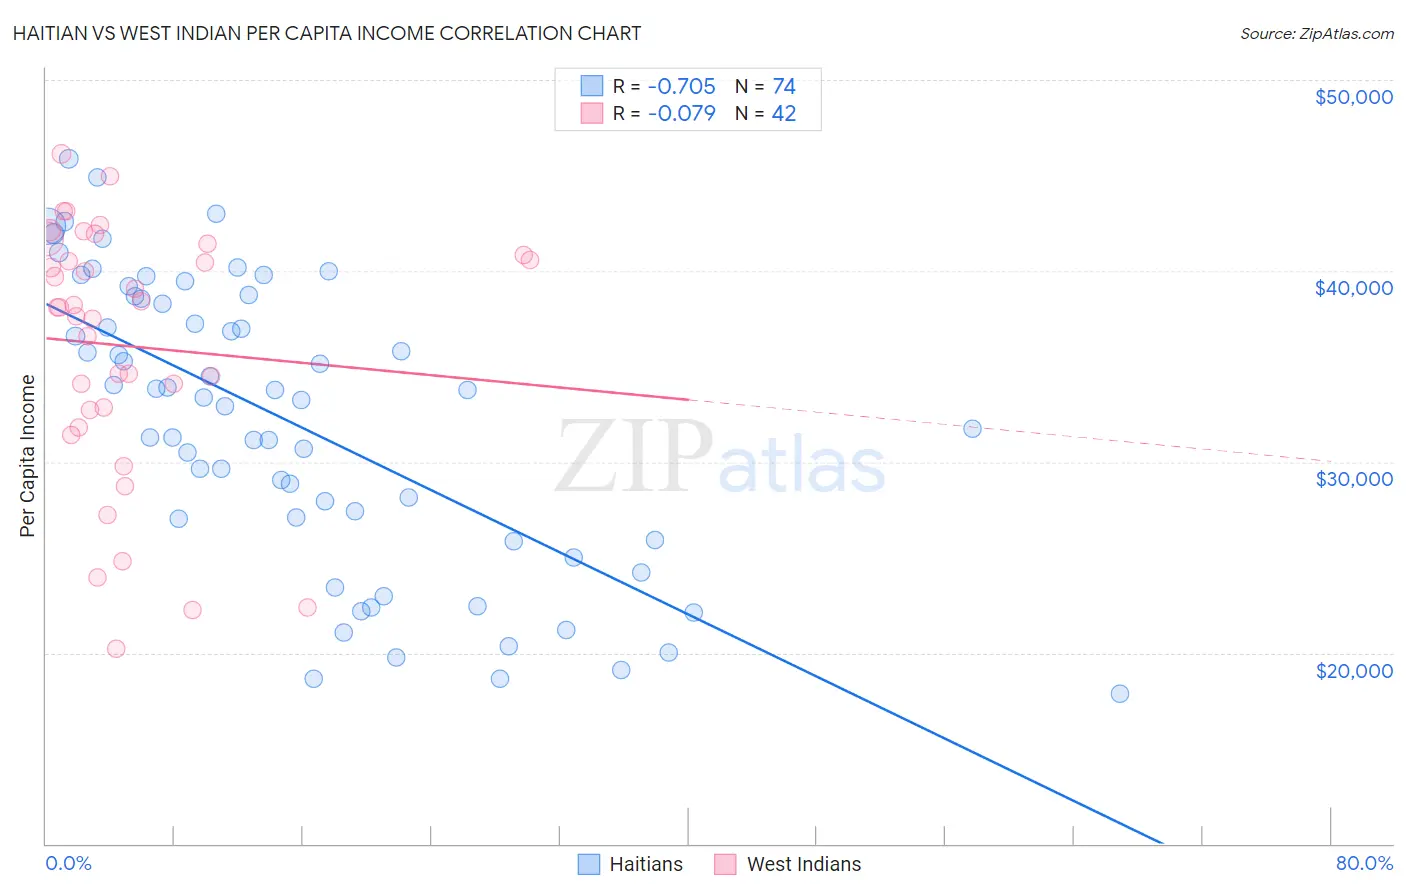
Haitian vs West Indian Per Capita Income Correlation Chart
The statistical analysis conducted on geographies consisting of 288,031,086 people shows a strong negative correlation between the proportion of Haitians and per capita income in the United States with a correlation coefficient (R) of -0.705 and weighted average of $37,289. Similarly, the statistical analysis conducted on geographies consisting of 254,069,364 people shows a slight negative correlation between the proportion of West Indians and per capita income in the United States with a correlation coefficient (R) of -0.079 and weighted average of $41,217, a difference of 10.5%.
Per Capita Income Correlation Summary
| Measurement | Haitian | West Indian |
| Minimum | $17,858 | $20,227 |
| Maximum | $45,871 | $46,150 |
| Range | $28,013 | $25,923 |
| Mean | $31,987 | $36,063 |
| Median | $33,320 | $38,086 |
| Interquartile 25% (IQ1) | $25,885 | $32,716 |
| Interquartile 75% (IQ3) | $38,541 | $40,860 |
| Interquartile Range (IQR) | $12,656 | $8,144 |
| Standard Deviation (Sample) | $7,480 | $6,624 |
| Standard Deviation (Population) | $7,429 | $6,544 |
Similar Demographics by Per Capita Income
Demographics Similar to Haitians by Per Capita Income
In terms of per capita income, the demographic groups most similar to Haitians are Indonesian ($37,300, a difference of 0.030%), Immigrants from Dominican Republic ($37,306, a difference of 0.040%), Immigrants from Caribbean ($37,254, a difference of 0.090%), Cherokee ($37,203, a difference of 0.23%), and Cuban ($37,383, a difference of 0.25%).
| Demographics | Rating | Rank | Per Capita Income |
| Immigrants | Guatemala | 0.1 /100 | #290 | Tragic $37,550 |
| Cajuns | 0.1 /100 | #291 | Tragic $37,527 |
| Immigrants | Micronesia | 0.1 /100 | #292 | Tragic $37,464 |
| Mexican American Indians | 0.1 /100 | #293 | Tragic $37,407 |
| Cubans | 0.1 /100 | #294 | Tragic $37,383 |
| Immigrants | Dominican Republic | 0.1 /100 | #295 | Tragic $37,306 |
| Indonesians | 0.1 /100 | #296 | Tragic $37,300 |
| Haitians | 0.1 /100 | #297 | Tragic $37,289 |
| Immigrants | Caribbean | 0.1 /100 | #298 | Tragic $37,254 |
| Cherokee | 0.1 /100 | #299 | Tragic $37,203 |
| Immigrants | Bahamas | 0.1 /100 | #300 | Tragic $37,193 |
| Ottawa | 0.1 /100 | #301 | Tragic $37,101 |
| Shoshone | 0.1 /100 | #302 | Tragic $37,072 |
| Paiute | 0.1 /100 | #303 | Tragic $37,066 |
| Hondurans | 0.1 /100 | #304 | Tragic $37,031 |
Demographics Similar to West Indians by Per Capita Income
In terms of per capita income, the demographic groups most similar to West Indians are Immigrants from Ecuador ($41,195, a difference of 0.050%), Immigrants from St. Vincent and the Grenadines ($41,270, a difference of 0.13%), Immigrants from Ghana ($41,131, a difference of 0.21%), Immigrants from Grenada ($41,123, a difference of 0.23%), and Immigrants from Cameroon ($41,334, a difference of 0.28%).
| Demographics | Rating | Rank | Per Capita Income |
| Trinidadians and Tobagonians | 9.5 /100 | #218 | Tragic $41,655 |
| Puget Sound Salish | 8.1 /100 | #219 | Tragic $41,495 |
| Immigrants | Barbados | 7.9 /100 | #220 | Tragic $41,478 |
| Immigrants | Trinidad and Tobago | 7.9 /100 | #221 | Tragic $41,476 |
| Immigrants | Iraq | 7.1 /100 | #222 | Tragic $41,365 |
| Immigrants | Cameroon | 6.8 /100 | #223 | Tragic $41,334 |
| Immigrants | St. Vincent and the Grenadines | 6.4 /100 | #224 | Tragic $41,270 |
| West Indians | 6.0 /100 | #225 | Tragic $41,217 |
| Immigrants | Ecuador | 5.9 /100 | #226 | Tragic $41,195 |
| Immigrants | Ghana | 5.5 /100 | #227 | Tragic $41,131 |
| Immigrants | Grenada | 5.5 /100 | #228 | Tragic $41,123 |
| Nigerians | 4.9 /100 | #229 | Tragic $41,026 |
| Native Hawaiians | 4.9 /100 | #230 | Tragic $41,017 |
| Senegalese | 4.8 /100 | #231 | Tragic $41,000 |
| Guyanese | 4.5 /100 | #232 | Tragic $40,949 |