Haitian vs Immigrants from South Eastern Asia Per Capita Income
COMPARE
Haitian
Immigrants from South Eastern Asia
Per Capita Income
Per Capita Income Comparison
Haitians
Immigrants from South Eastern Asia
$37,289
PER CAPITA INCOME
0.1/ 100
METRIC RATING
297th/ 347
METRIC RANK
$43,539
PER CAPITA INCOME
46.6/ 100
METRIC RATING
176th/ 347
METRIC RANK
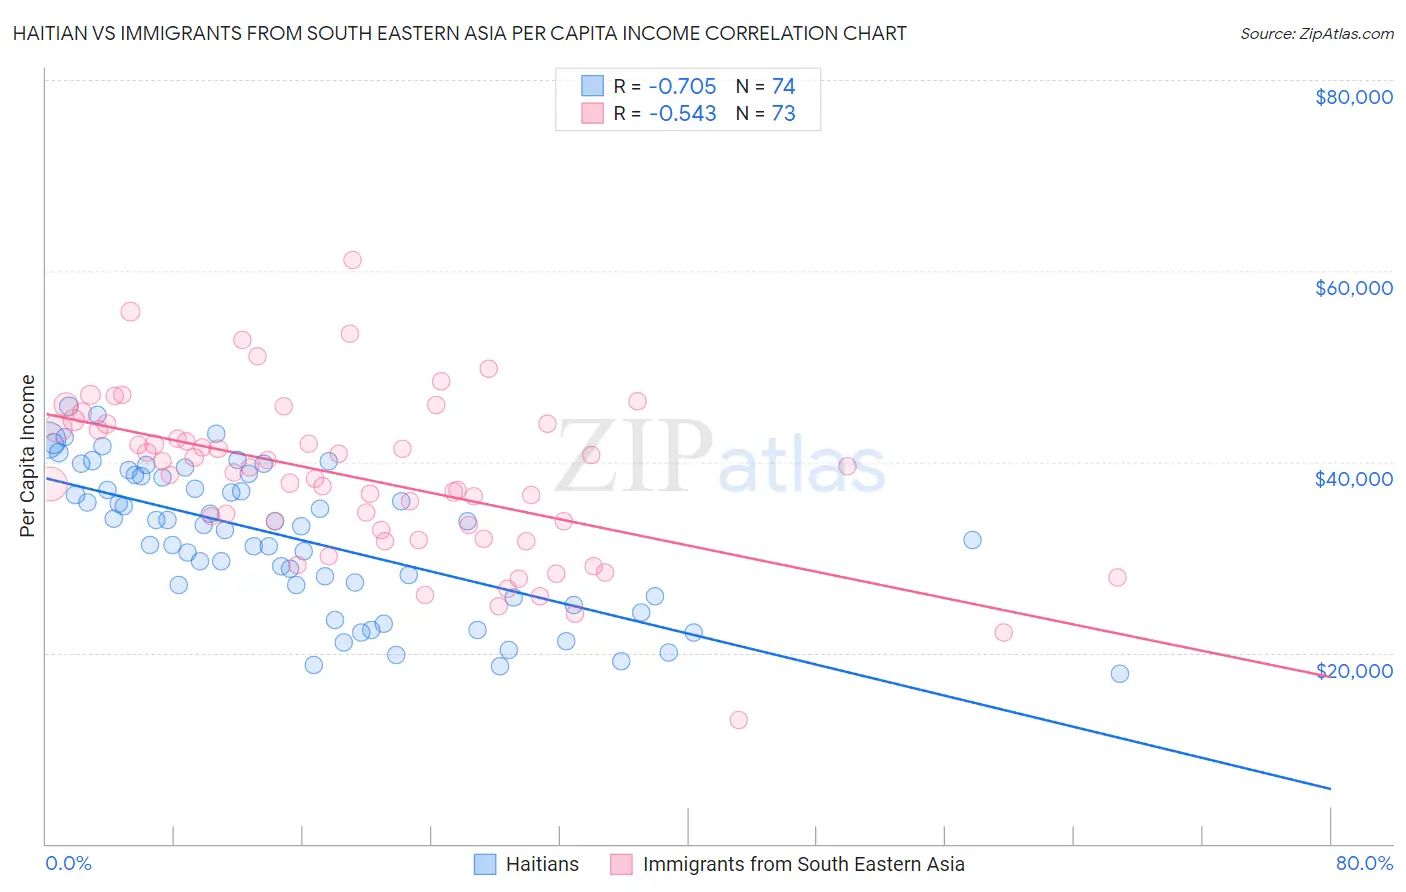
Haitian vs Immigrants from South Eastern Asia Per Capita Income Correlation Chart
The statistical analysis conducted on geographies consisting of 288,031,086 people shows a strong negative correlation between the proportion of Haitians and per capita income in the United States with a correlation coefficient (R) of -0.705 and weighted average of $37,289. Similarly, the statistical analysis conducted on geographies consisting of 512,740,931 people shows a substantial negative correlation between the proportion of Immigrants from South Eastern Asia and per capita income in the United States with a correlation coefficient (R) of -0.543 and weighted average of $43,539, a difference of 16.8%.
Per Capita Income Correlation Summary
| Measurement | Haitian | Immigrants from South Eastern Asia |
| Minimum | $17,858 | $12,941 |
| Maximum | $45,871 | $61,192 |
| Range | $28,013 | $48,251 |
| Mean | $31,987 | $38,281 |
| Median | $33,320 | $38,844 |
| Interquartile 25% (IQ1) | $25,885 | $32,392 |
| Interquartile 75% (IQ3) | $38,541 | $43,736 |
| Interquartile Range (IQR) | $12,656 | $11,344 |
| Standard Deviation (Sample) | $7,480 | $8,472 |
| Standard Deviation (Population) | $7,429 | $8,414 |
Similar Demographics by Per Capita Income
Demographics Similar to Haitians by Per Capita Income
In terms of per capita income, the demographic groups most similar to Haitians are Indonesian ($37,300, a difference of 0.030%), Immigrants from Dominican Republic ($37,306, a difference of 0.040%), Immigrants from Caribbean ($37,254, a difference of 0.090%), Cherokee ($37,203, a difference of 0.23%), and Cuban ($37,383, a difference of 0.25%).
| Demographics | Rating | Rank | Per Capita Income |
| Immigrants | Guatemala | 0.1 /100 | #290 | Tragic $37,550 |
| Cajuns | 0.1 /100 | #291 | Tragic $37,527 |
| Immigrants | Micronesia | 0.1 /100 | #292 | Tragic $37,464 |
| Mexican American Indians | 0.1 /100 | #293 | Tragic $37,407 |
| Cubans | 0.1 /100 | #294 | Tragic $37,383 |
| Immigrants | Dominican Republic | 0.1 /100 | #295 | Tragic $37,306 |
| Indonesians | 0.1 /100 | #296 | Tragic $37,300 |
| Haitians | 0.1 /100 | #297 | Tragic $37,289 |
| Immigrants | Caribbean | 0.1 /100 | #298 | Tragic $37,254 |
| Cherokee | 0.1 /100 | #299 | Tragic $37,203 |
| Immigrants | Bahamas | 0.1 /100 | #300 | Tragic $37,193 |
| Ottawa | 0.1 /100 | #301 | Tragic $37,101 |
| Shoshone | 0.1 /100 | #302 | Tragic $37,072 |
| Paiute | 0.1 /100 | #303 | Tragic $37,066 |
| Hondurans | 0.1 /100 | #304 | Tragic $37,031 |
Demographics Similar to Immigrants from South Eastern Asia by Per Capita Income
In terms of per capita income, the demographic groups most similar to Immigrants from South Eastern Asia are Tlingit-Haida ($43,516, a difference of 0.050%), Immigrants from Costa Rica ($43,464, a difference of 0.17%), Finnish ($43,461, a difference of 0.18%), Celtic ($43,621, a difference of 0.19%), and Colombian ($43,661, a difference of 0.28%).
| Demographics | Rating | Rank | Per Capita Income |
| Immigrants | Peru | 55.3 /100 | #169 | Average $43,852 |
| Scandinavians | 55.2 /100 | #170 | Average $43,848 |
| Immigrants | Eastern Africa | 54.9 /100 | #171 | Average $43,838 |
| Czechoslovakians | 54.1 /100 | #172 | Average $43,806 |
| French | 50.7 /100 | #173 | Average $43,685 |
| Colombians | 50.0 /100 | #174 | Average $43,661 |
| Celtics | 48.9 /100 | #175 | Average $43,621 |
| Immigrants | South Eastern Asia | 46.6 /100 | #176 | Average $43,539 |
| Tlingit-Haida | 45.9 /100 | #177 | Average $43,516 |
| Immigrants | Costa Rica | 44.5 /100 | #178 | Average $43,464 |
| Finns | 44.4 /100 | #179 | Average $43,461 |
| Sierra Leoneans | 42.9 /100 | #180 | Average $43,405 |
| Welsh | 38.2 /100 | #181 | Fair $43,233 |
| Immigrants | Vietnam | 38.1 /100 | #182 | Fair $43,229 |
| Germans | 33.9 /100 | #183 | Fair $43,067 |