Haitian vs Latvian Per Capita Income
COMPARE
Haitian
Latvian
Per Capita Income
Per Capita Income Comparison
Haitians
Latvians
$37,289
PER CAPITA INCOME
0.1/ 100
METRIC RATING
297th/ 347
METRIC RANK
$52,649
PER CAPITA INCOME
100.0/ 100
METRIC RATING
28th/ 347
METRIC RANK
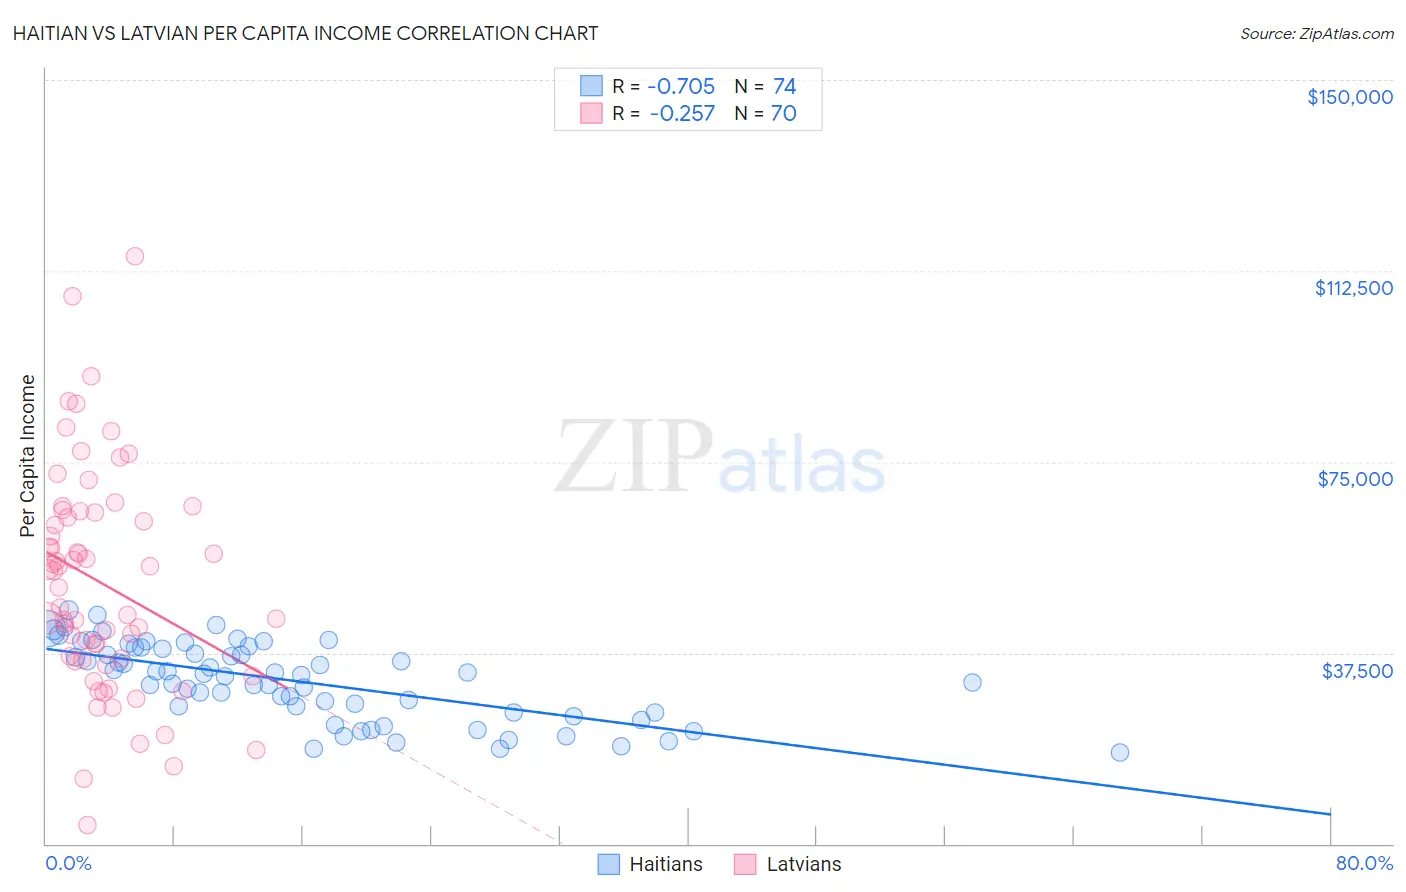
Haitian vs Latvian Per Capita Income Correlation Chart
The statistical analysis conducted on geographies consisting of 288,031,086 people shows a strong negative correlation between the proportion of Haitians and per capita income in the United States with a correlation coefficient (R) of -0.705 and weighted average of $37,289. Similarly, the statistical analysis conducted on geographies consisting of 220,728,386 people shows a weak negative correlation between the proportion of Latvians and per capita income in the United States with a correlation coefficient (R) of -0.257 and weighted average of $52,649, a difference of 41.2%.
Per Capita Income Correlation Summary
| Measurement | Haitian | Latvian |
| Minimum | $17,858 | $3,646 |
| Maximum | $45,871 | $115,504 |
| Range | $28,013 | $111,858 |
| Mean | $31,987 | $51,165 |
| Median | $33,320 | $52,046 |
| Interquartile 25% (IQ1) | $25,885 | $36,086 |
| Interquartile 75% (IQ3) | $38,541 | $65,124 |
| Interquartile Range (IQR) | $12,656 | $29,038 |
| Standard Deviation (Sample) | $7,480 | $21,773 |
| Standard Deviation (Population) | $7,429 | $21,617 |
Similar Demographics by Per Capita Income
Demographics Similar to Haitians by Per Capita Income
In terms of per capita income, the demographic groups most similar to Haitians are Indonesian ($37,300, a difference of 0.030%), Immigrants from Dominican Republic ($37,306, a difference of 0.040%), Immigrants from Caribbean ($37,254, a difference of 0.090%), Cherokee ($37,203, a difference of 0.23%), and Cuban ($37,383, a difference of 0.25%).
| Demographics | Rating | Rank | Per Capita Income |
| Immigrants | Guatemala | 0.1 /100 | #290 | Tragic $37,550 |
| Cajuns | 0.1 /100 | #291 | Tragic $37,527 |
| Immigrants | Micronesia | 0.1 /100 | #292 | Tragic $37,464 |
| Mexican American Indians | 0.1 /100 | #293 | Tragic $37,407 |
| Cubans | 0.1 /100 | #294 | Tragic $37,383 |
| Immigrants | Dominican Republic | 0.1 /100 | #295 | Tragic $37,306 |
| Indonesians | 0.1 /100 | #296 | Tragic $37,300 |
| Haitians | 0.1 /100 | #297 | Tragic $37,289 |
| Immigrants | Caribbean | 0.1 /100 | #298 | Tragic $37,254 |
| Cherokee | 0.1 /100 | #299 | Tragic $37,203 |
| Immigrants | Bahamas | 0.1 /100 | #300 | Tragic $37,193 |
| Ottawa | 0.1 /100 | #301 | Tragic $37,101 |
| Shoshone | 0.1 /100 | #302 | Tragic $37,072 |
| Paiute | 0.1 /100 | #303 | Tragic $37,066 |
| Hondurans | 0.1 /100 | #304 | Tragic $37,031 |
Demographics Similar to Latvians by Per Capita Income
In terms of per capita income, the demographic groups most similar to Latvians are Immigrants from South Central Asia ($52,660, a difference of 0.020%), Israeli ($52,596, a difference of 0.10%), Immigrants from Austria ($52,503, a difference of 0.28%), Turkish ($52,391, a difference of 0.49%), and Immigrants from Norway ($52,217, a difference of 0.83%).
| Demographics | Rating | Rank | Per Capita Income |
| Immigrants | Northern Europe | 100.0 /100 | #21 | Exceptional $54,159 |
| Indians (Asian) | 100.0 /100 | #22 | Exceptional $53,874 |
| Immigrants | Eastern Asia | 100.0 /100 | #23 | Exceptional $53,806 |
| Immigrants | Denmark | 100.0 /100 | #24 | Exceptional $53,799 |
| Immigrants | Japan | 100.0 /100 | #25 | Exceptional $53,359 |
| Russians | 100.0 /100 | #26 | Exceptional $53,154 |
| Immigrants | South Central Asia | 100.0 /100 | #27 | Exceptional $52,660 |
| Latvians | 100.0 /100 | #28 | Exceptional $52,649 |
| Israelis | 100.0 /100 | #29 | Exceptional $52,596 |
| Immigrants | Austria | 100.0 /100 | #30 | Exceptional $52,503 |
| Turks | 100.0 /100 | #31 | Exceptional $52,391 |
| Immigrants | Norway | 100.0 /100 | #32 | Exceptional $52,217 |
| Australians | 100.0 /100 | #33 | Exceptional $52,074 |
| Immigrants | Russia | 100.0 /100 | #34 | Exceptional $52,044 |
| Burmese | 100.0 /100 | #35 | Exceptional $52,005 |