Haitian vs Immigrants from Armenia Per Capita Income
COMPARE
Haitian
Immigrants from Armenia
Per Capita Income
Per Capita Income Comparison
Haitians
Immigrants from Armenia
$37,289
PER CAPITA INCOME
0.1/ 100
METRIC RATING
297th/ 347
METRIC RANK
$44,552
PER CAPITA INCOME
73.1/ 100
METRIC RATING
148th/ 347
METRIC RANK
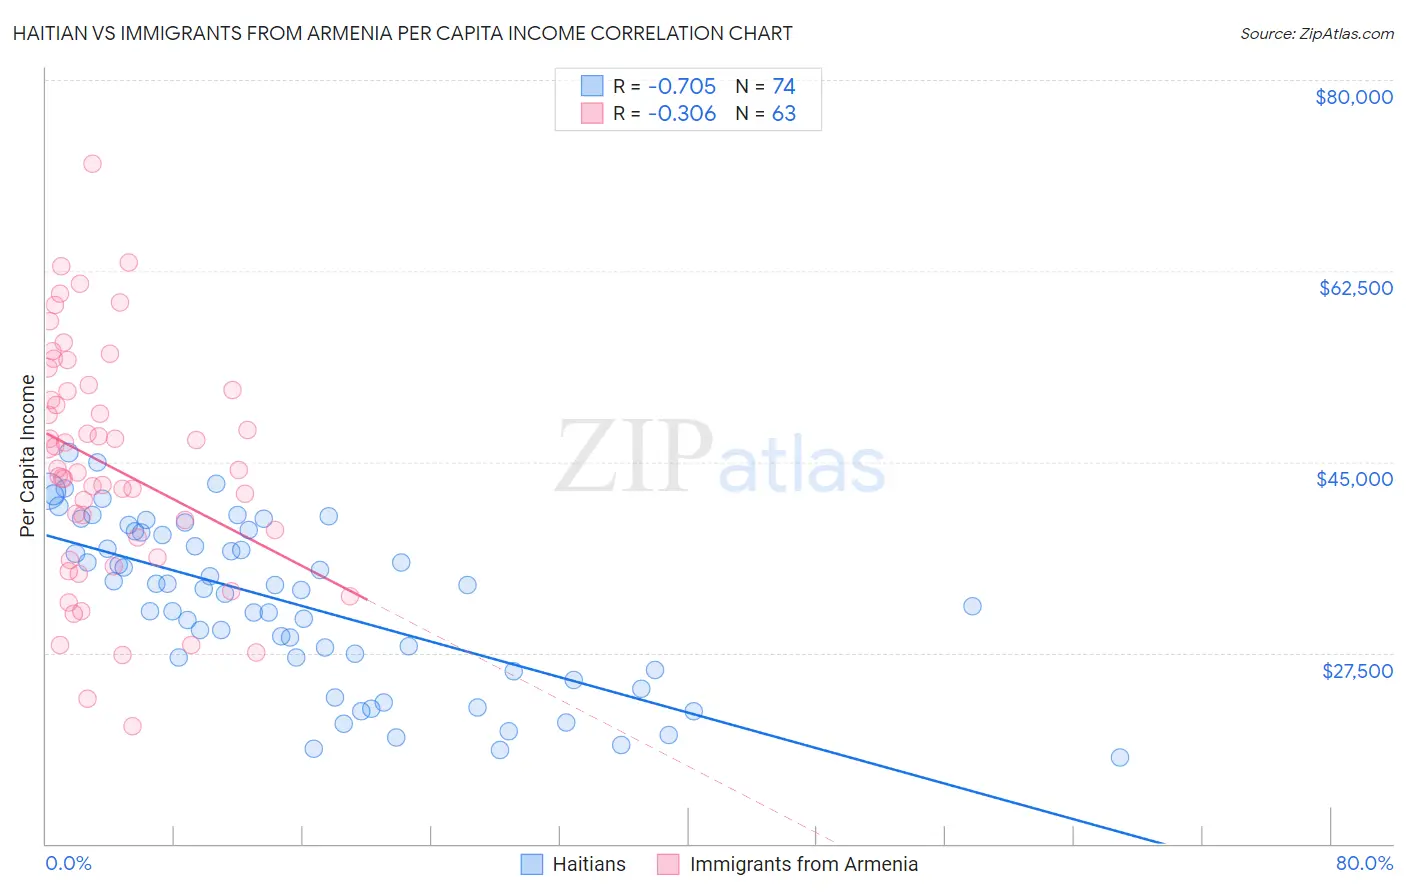
Haitian vs Immigrants from Armenia Per Capita Income Correlation Chart
The statistical analysis conducted on geographies consisting of 288,031,086 people shows a strong negative correlation between the proportion of Haitians and per capita income in the United States with a correlation coefficient (R) of -0.705 and weighted average of $37,289. Similarly, the statistical analysis conducted on geographies consisting of 97,724,966 people shows a mild negative correlation between the proportion of Immigrants from Armenia and per capita income in the United States with a correlation coefficient (R) of -0.306 and weighted average of $44,552, a difference of 19.5%.
Per Capita Income Correlation Summary
| Measurement | Haitian | Immigrants from Armenia |
| Minimum | $17,858 | $20,812 |
| Maximum | $45,871 | $72,364 |
| Range | $28,013 | $51,552 |
| Mean | $31,987 | $44,626 |
| Median | $33,320 | $44,298 |
| Interquartile 25% (IQ1) | $25,885 | $36,237 |
| Interquartile 75% (IQ3) | $38,541 | $51,558 |
| Interquartile Range (IQR) | $12,656 | $15,321 |
| Standard Deviation (Sample) | $7,480 | $10,685 |
| Standard Deviation (Population) | $7,429 | $10,600 |
Similar Demographics by Per Capita Income
Demographics Similar to Haitians by Per Capita Income
In terms of per capita income, the demographic groups most similar to Haitians are Indonesian ($37,300, a difference of 0.030%), Immigrants from Dominican Republic ($37,306, a difference of 0.040%), Immigrants from Caribbean ($37,254, a difference of 0.090%), Cherokee ($37,203, a difference of 0.23%), and Cuban ($37,383, a difference of 0.25%).
| Demographics | Rating | Rank | Per Capita Income |
| Immigrants | Guatemala | 0.1 /100 | #290 | Tragic $37,550 |
| Cajuns | 0.1 /100 | #291 | Tragic $37,527 |
| Immigrants | Micronesia | 0.1 /100 | #292 | Tragic $37,464 |
| Mexican American Indians | 0.1 /100 | #293 | Tragic $37,407 |
| Cubans | 0.1 /100 | #294 | Tragic $37,383 |
| Immigrants | Dominican Republic | 0.1 /100 | #295 | Tragic $37,306 |
| Indonesians | 0.1 /100 | #296 | Tragic $37,300 |
| Haitians | 0.1 /100 | #297 | Tragic $37,289 |
| Immigrants | Caribbean | 0.1 /100 | #298 | Tragic $37,254 |
| Cherokee | 0.1 /100 | #299 | Tragic $37,203 |
| Immigrants | Bahamas | 0.1 /100 | #300 | Tragic $37,193 |
| Ottawa | 0.1 /100 | #301 | Tragic $37,101 |
| Shoshone | 0.1 /100 | #302 | Tragic $37,072 |
| Paiute | 0.1 /100 | #303 | Tragic $37,066 |
| Hondurans | 0.1 /100 | #304 | Tragic $37,031 |
Demographics Similar to Immigrants from Armenia by Per Capita Income
In terms of per capita income, the demographic groups most similar to Immigrants from Armenia are Korean ($44,522, a difference of 0.070%), Czech ($44,595, a difference of 0.10%), Immigrants from Eritrea ($44,509, a difference of 0.10%), Norwegian ($44,480, a difference of 0.16%), and Peruvian ($44,479, a difference of 0.17%).
| Demographics | Rating | Rank | Per Capita Income |
| Slavs | 82.6 /100 | #141 | Excellent $45,049 |
| Ugandans | 82.6 /100 | #142 | Excellent $45,047 |
| Immigrants | Uganda | 82.5 /100 | #143 | Excellent $45,043 |
| Icelanders | 81.6 /100 | #144 | Excellent $44,987 |
| Immigrants | Afghanistan | 78.0 /100 | #145 | Good $44,790 |
| Irish | 75.8 /100 | #146 | Good $44,679 |
| Czechs | 74.1 /100 | #147 | Good $44,595 |
| Immigrants | Armenia | 73.1 /100 | #148 | Good $44,552 |
| Koreans | 72.5 /100 | #149 | Good $44,522 |
| Immigrants | Eritrea | 72.1 /100 | #150 | Good $44,509 |
| Norwegians | 71.5 /100 | #151 | Good $44,480 |
| Peruvians | 71.5 /100 | #152 | Good $44,479 |
| Scottish | 70.6 /100 | #153 | Good $44,440 |
| Portuguese | 68.7 /100 | #154 | Good $44,362 |
| Uruguayans | 67.6 /100 | #155 | Good $44,318 |