Guatemalan vs Immigrants from Senegal Median Earnings
COMPARE
Guatemalan
Immigrants from Senegal
Median Earnings
Median Earnings Comparison
Guatemalans
Immigrants from Senegal
$41,205
MEDIAN EARNINGS
0.1/ 100
METRIC RATING
297th/ 347
METRIC RANK
$45,611
MEDIAN EARNINGS
24.0/ 100
METRIC RATING
207th/ 347
METRIC RANK
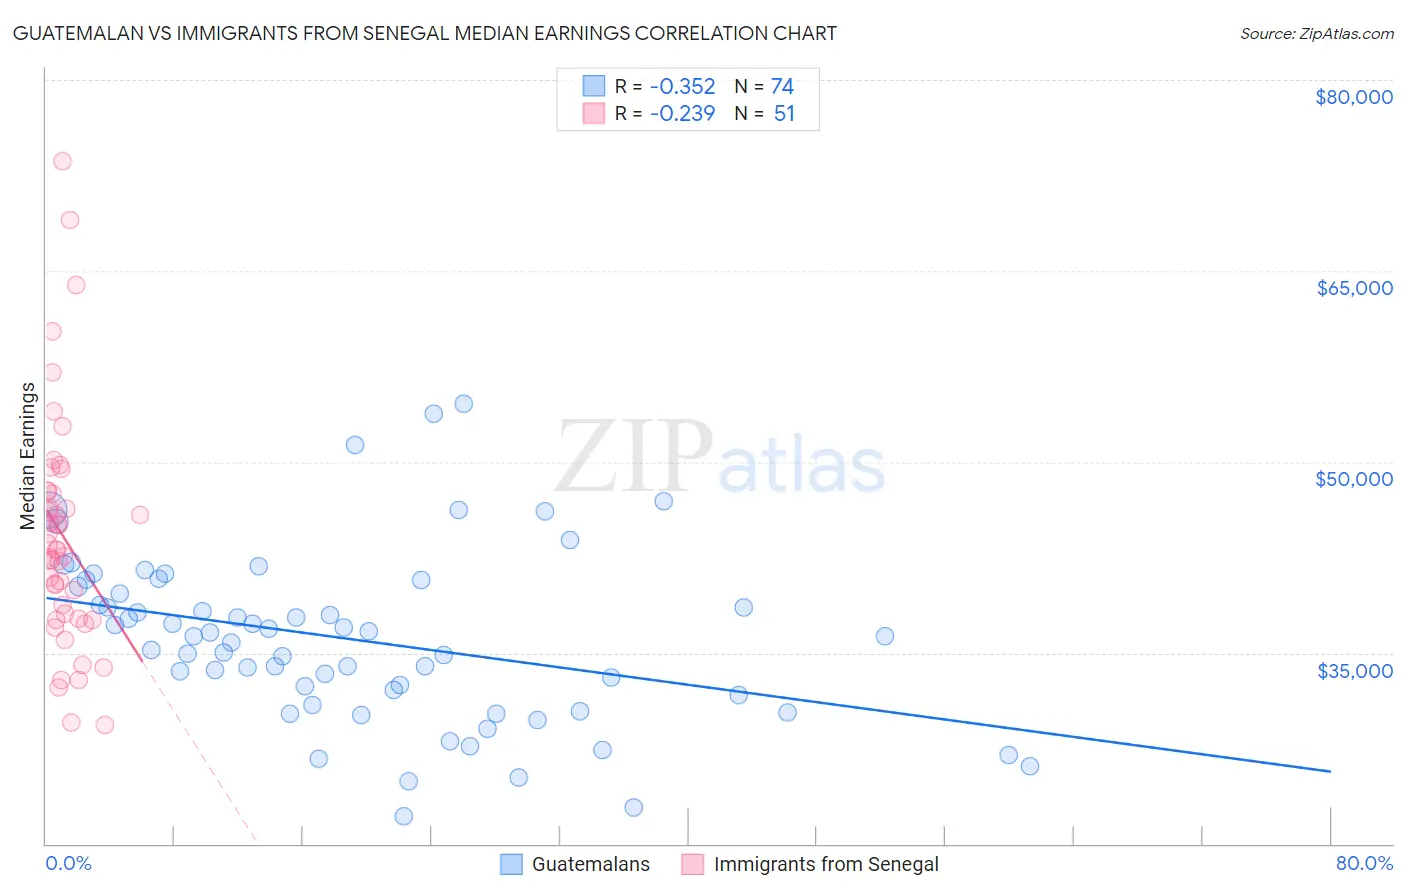
Guatemalan vs Immigrants from Senegal Median Earnings Correlation Chart
The statistical analysis conducted on geographies consisting of 409,559,083 people shows a mild negative correlation between the proportion of Guatemalans and median earnings in the United States with a correlation coefficient (R) of -0.352 and weighted average of $41,205. Similarly, the statistical analysis conducted on geographies consisting of 90,128,045 people shows a weak negative correlation between the proportion of Immigrants from Senegal and median earnings in the United States with a correlation coefficient (R) of -0.239 and weighted average of $45,611, a difference of 10.7%.
Median Earnings Correlation Summary
| Measurement | Guatemalan | Immigrants from Senegal |
| Minimum | $22,174 | $29,284 |
| Maximum | $54,583 | $73,618 |
| Range | $32,409 | $44,334 |
| Mean | $36,063 | $44,131 |
| Median | $36,315 | $43,043 |
| Interquartile 25% (IQ1) | $31,673 | $37,628 |
| Interquartile 75% (IQ3) | $40,213 | $47,719 |
| Interquartile Range (IQR) | $8,540 | $10,091 |
| Standard Deviation (Sample) | $6,708 | $9,098 |
| Standard Deviation (Population) | $6,663 | $9,008 |
Similar Demographics by Median Earnings
Demographics Similar to Guatemalans by Median Earnings
In terms of median earnings, the demographic groups most similar to Guatemalans are Cherokee ($41,252, a difference of 0.11%), Bangladeshi ($41,263, a difference of 0.14%), Immigrants from Micronesia ($41,133, a difference of 0.17%), Potawatomi ($41,288, a difference of 0.20%), and Immigrants from Caribbean ($41,119, a difference of 0.21%).
| Demographics | Rating | Rank | Median Earnings |
| Paiute | 0.1 /100 | #290 | Tragic $41,508 |
| Central American Indians | 0.1 /100 | #291 | Tragic $41,474 |
| U.S. Virgin Islanders | 0.1 /100 | #292 | Tragic $41,448 |
| Immigrants | Zaire | 0.1 /100 | #293 | Tragic $41,325 |
| Potawatomi | 0.1 /100 | #294 | Tragic $41,288 |
| Bangladeshis | 0.1 /100 | #295 | Tragic $41,263 |
| Cherokee | 0.1 /100 | #296 | Tragic $41,252 |
| Guatemalans | 0.1 /100 | #297 | Tragic $41,205 |
| Immigrants | Micronesia | 0.1 /100 | #298 | Tragic $41,133 |
| Immigrants | Caribbean | 0.1 /100 | #299 | Tragic $41,119 |
| Ute | 0.1 /100 | #300 | Tragic $41,051 |
| Immigrants | Latin America | 0.1 /100 | #301 | Tragic $41,049 |
| Shoshone | 0.0 /100 | #302 | Tragic $40,932 |
| Haitians | 0.0 /100 | #303 | Tragic $40,918 |
| Immigrants | Guatemala | 0.0 /100 | #304 | Tragic $40,851 |
Demographics Similar to Immigrants from Senegal by Median Earnings
In terms of median earnings, the demographic groups most similar to Immigrants from Senegal are Immigrants from Bosnia and Herzegovina ($45,600, a difference of 0.020%), Immigrants from Thailand ($45,598, a difference of 0.030%), Immigrants from Grenada ($45,596, a difference of 0.030%), Panamanian ($45,593, a difference of 0.040%), and Bermudan ($45,593, a difference of 0.040%).
| Demographics | Rating | Rank | Median Earnings |
| Immigrants | Azores | 29.5 /100 | #200 | Fair $45,812 |
| Celtics | 27.2 /100 | #201 | Fair $45,732 |
| Immigrants | Trinidad and Tobago | 27.1 /100 | #202 | Fair $45,729 |
| Welsh | 26.6 /100 | #203 | Fair $45,710 |
| Immigrants | Uruguay | 25.9 /100 | #204 | Fair $45,682 |
| Tongans | 25.4 /100 | #205 | Fair $45,665 |
| Immigrants | Ghana | 24.8 /100 | #206 | Fair $45,641 |
| Immigrants | Senegal | 24.0 /100 | #207 | Fair $45,611 |
| Immigrants | Bosnia and Herzegovina | 23.7 /100 | #208 | Fair $45,600 |
| Immigrants | Thailand | 23.7 /100 | #209 | Fair $45,598 |
| Immigrants | Grenada | 23.6 /100 | #210 | Fair $45,596 |
| Panamanians | 23.5 /100 | #211 | Fair $45,593 |
| Bermudans | 23.5 /100 | #212 | Fair $45,593 |
| Immigrants | Colombia | 22.4 /100 | #213 | Fair $45,550 |
| Nigerians | 22.0 /100 | #214 | Fair $45,532 |