Guatemalan vs South American Median Earnings
COMPARE
Guatemalan
South American
Median Earnings
Median Earnings Comparison
Guatemalans
South Americans
$41,205
MEDIAN EARNINGS
0.1/ 100
METRIC RATING
297th/ 347
METRIC RANK
$46,804
MEDIAN EARNINGS
62.7/ 100
METRIC RATING
165th/ 347
METRIC RANK
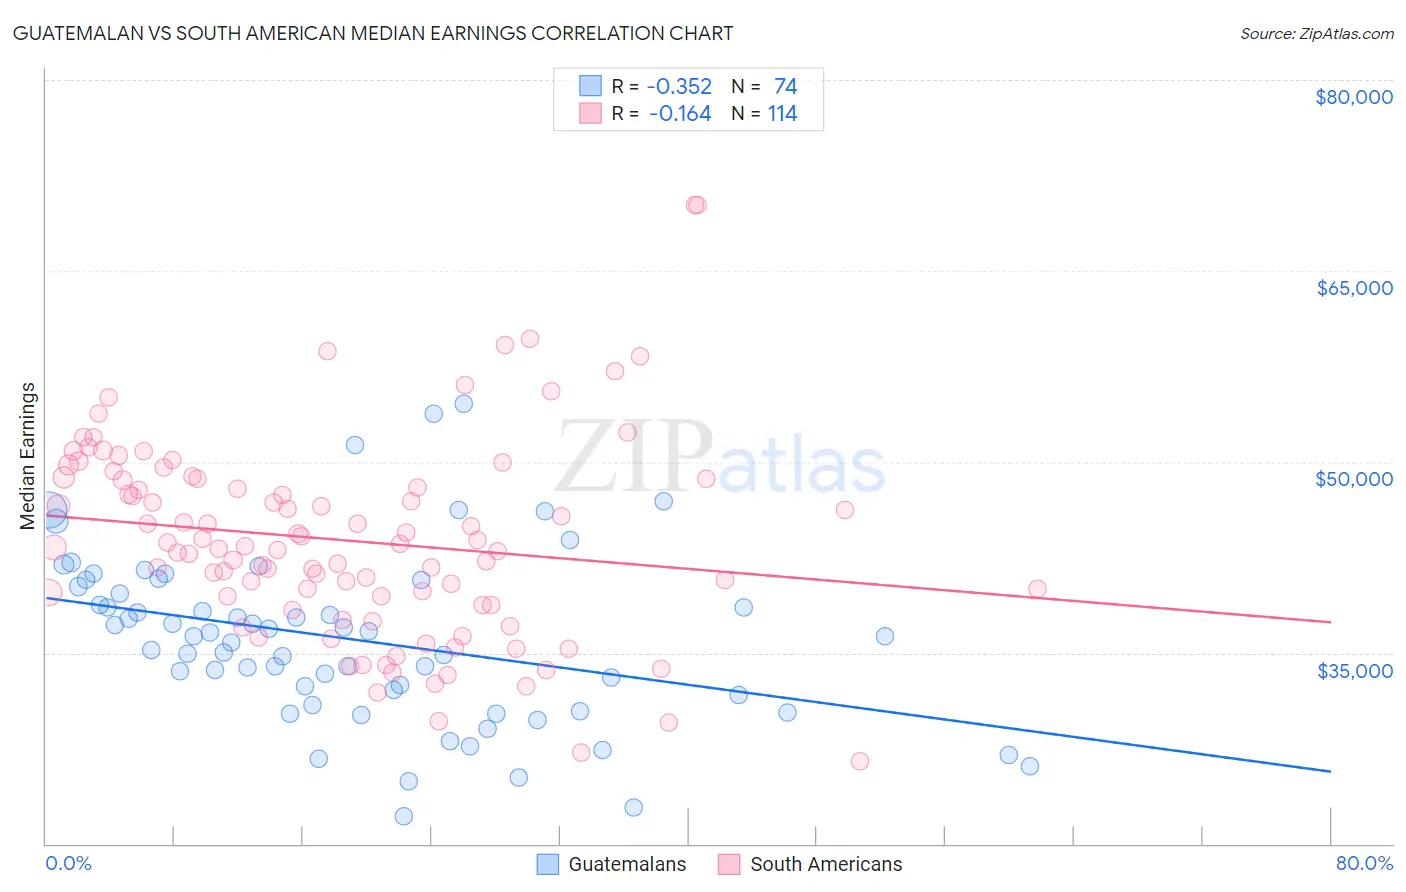
Guatemalan vs South American Median Earnings Correlation Chart
The statistical analysis conducted on geographies consisting of 409,559,083 people shows a mild negative correlation between the proportion of Guatemalans and median earnings in the United States with a correlation coefficient (R) of -0.352 and weighted average of $41,205. Similarly, the statistical analysis conducted on geographies consisting of 494,103,874 people shows a poor negative correlation between the proportion of South Americans and median earnings in the United States with a correlation coefficient (R) of -0.164 and weighted average of $46,804, a difference of 13.6%.
Median Earnings Correlation Summary
| Measurement | Guatemalan | South American |
| Minimum | $22,174 | $26,500 |
| Maximum | $54,583 | $70,221 |
| Range | $32,409 | $43,721 |
| Mean | $36,063 | $43,826 |
| Median | $36,315 | $43,308 |
| Interquartile 25% (IQ1) | $31,673 | $38,802 |
| Interquartile 75% (IQ3) | $40,213 | $48,652 |
| Interquartile Range (IQR) | $8,540 | $9,850 |
| Standard Deviation (Sample) | $6,708 | $7,886 |
| Standard Deviation (Population) | $6,663 | $7,851 |
Similar Demographics by Median Earnings
Demographics Similar to Guatemalans by Median Earnings
In terms of median earnings, the demographic groups most similar to Guatemalans are Cherokee ($41,252, a difference of 0.11%), Bangladeshi ($41,263, a difference of 0.14%), Immigrants from Micronesia ($41,133, a difference of 0.17%), Potawatomi ($41,288, a difference of 0.20%), and Immigrants from Caribbean ($41,119, a difference of 0.21%).
| Demographics | Rating | Rank | Median Earnings |
| Paiute | 0.1 /100 | #290 | Tragic $41,508 |
| Central American Indians | 0.1 /100 | #291 | Tragic $41,474 |
| U.S. Virgin Islanders | 0.1 /100 | #292 | Tragic $41,448 |
| Immigrants | Zaire | 0.1 /100 | #293 | Tragic $41,325 |
| Potawatomi | 0.1 /100 | #294 | Tragic $41,288 |
| Bangladeshis | 0.1 /100 | #295 | Tragic $41,263 |
| Cherokee | 0.1 /100 | #296 | Tragic $41,252 |
| Guatemalans | 0.1 /100 | #297 | Tragic $41,205 |
| Immigrants | Micronesia | 0.1 /100 | #298 | Tragic $41,133 |
| Immigrants | Caribbean | 0.1 /100 | #299 | Tragic $41,119 |
| Ute | 0.1 /100 | #300 | Tragic $41,051 |
| Immigrants | Latin America | 0.1 /100 | #301 | Tragic $41,049 |
| Shoshone | 0.0 /100 | #302 | Tragic $40,932 |
| Haitians | 0.0 /100 | #303 | Tragic $40,918 |
| Immigrants | Guatemala | 0.0 /100 | #304 | Tragic $40,851 |
Demographics Similar to South Americans by Median Earnings
In terms of median earnings, the demographic groups most similar to South Americans are Norwegian ($46,865, a difference of 0.13%), Icelander ($46,916, a difference of 0.24%), Czechoslovakian ($46,658, a difference of 0.31%), South American Indian ($46,952, a difference of 0.32%), and Costa Rican ($46,645, a difference of 0.34%).
| Demographics | Rating | Rank | Median Earnings |
| Slovaks | 71.7 /100 | #158 | Good $47,095 |
| Immigrants | Peru | 69.6 /100 | #159 | Good $47,025 |
| Alsatians | 69.6 /100 | #160 | Good $47,023 |
| Immigrants | Eastern Africa | 68.0 /100 | #161 | Good $46,969 |
| South American Indians | 67.4 /100 | #162 | Good $46,952 |
| Icelanders | 66.3 /100 | #163 | Good $46,916 |
| Norwegians | 64.7 /100 | #164 | Good $46,865 |
| South Americans | 62.7 /100 | #165 | Good $46,804 |
| Czechoslovakians | 57.8 /100 | #166 | Average $46,658 |
| Costa Ricans | 57.4 /100 | #167 | Average $46,645 |
| Immigrants | Africa | 54.6 /100 | #168 | Average $46,564 |
| Immigrants | South America | 54.0 /100 | #169 | Average $46,548 |
| Immigrants | Immigrants | 51.6 /100 | #170 | Average $46,478 |
| Scottish | 51.1 /100 | #171 | Average $46,463 |
| Kenyans | 51.0 /100 | #172 | Average $46,462 |