Guatemalan vs Australian Median Earnings
COMPARE
Guatemalan
Australian
Median Earnings
Median Earnings Comparison
Guatemalans
Australians
$41,205
MEDIAN EARNINGS
0.1/ 100
METRIC RATING
297th/ 347
METRIC RANK
$52,294
MEDIAN EARNINGS
100.0/ 100
METRIC RATING
47th/ 347
METRIC RANK
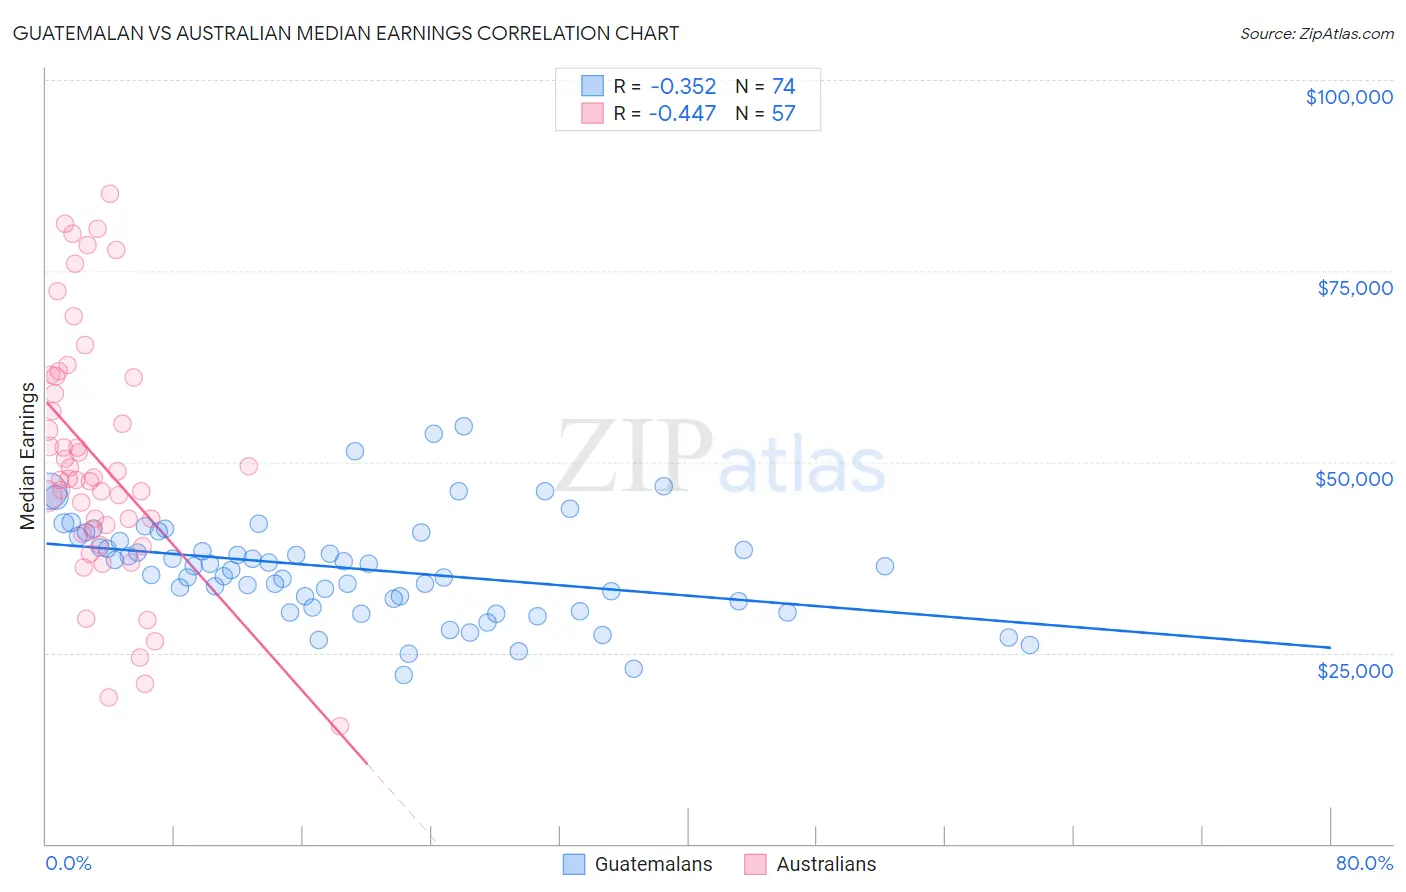
Guatemalan vs Australian Median Earnings Correlation Chart
The statistical analysis conducted on geographies consisting of 409,559,083 people shows a mild negative correlation between the proportion of Guatemalans and median earnings in the United States with a correlation coefficient (R) of -0.352 and weighted average of $41,205. Similarly, the statistical analysis conducted on geographies consisting of 224,158,339 people shows a moderate negative correlation between the proportion of Australians and median earnings in the United States with a correlation coefficient (R) of -0.447 and weighted average of $52,294, a difference of 26.9%.
Median Earnings Correlation Summary
| Measurement | Guatemalan | Australian |
| Minimum | $22,174 | $15,451 |
| Maximum | $54,583 | $85,069 |
| Range | $32,409 | $69,618 |
| Mean | $36,063 | $50,151 |
| Median | $36,315 | $47,849 |
| Interquartile 25% (IQ1) | $31,673 | $40,819 |
| Interquartile 75% (IQ3) | $40,213 | $61,206 |
| Interquartile Range (IQR) | $8,540 | $20,387 |
| Standard Deviation (Sample) | $6,708 | $16,224 |
| Standard Deviation (Population) | $6,663 | $16,081 |
Similar Demographics by Median Earnings
Demographics Similar to Guatemalans by Median Earnings
In terms of median earnings, the demographic groups most similar to Guatemalans are Cherokee ($41,252, a difference of 0.11%), Bangladeshi ($41,263, a difference of 0.14%), Immigrants from Micronesia ($41,133, a difference of 0.17%), Potawatomi ($41,288, a difference of 0.20%), and Immigrants from Caribbean ($41,119, a difference of 0.21%).
| Demographics | Rating | Rank | Median Earnings |
| Paiute | 0.1 /100 | #290 | Tragic $41,508 |
| Central American Indians | 0.1 /100 | #291 | Tragic $41,474 |
| U.S. Virgin Islanders | 0.1 /100 | #292 | Tragic $41,448 |
| Immigrants | Zaire | 0.1 /100 | #293 | Tragic $41,325 |
| Potawatomi | 0.1 /100 | #294 | Tragic $41,288 |
| Bangladeshis | 0.1 /100 | #295 | Tragic $41,263 |
| Cherokee | 0.1 /100 | #296 | Tragic $41,252 |
| Guatemalans | 0.1 /100 | #297 | Tragic $41,205 |
| Immigrants | Micronesia | 0.1 /100 | #298 | Tragic $41,133 |
| Immigrants | Caribbean | 0.1 /100 | #299 | Tragic $41,119 |
| Ute | 0.1 /100 | #300 | Tragic $41,051 |
| Immigrants | Latin America | 0.1 /100 | #301 | Tragic $41,049 |
| Shoshone | 0.0 /100 | #302 | Tragic $40,932 |
| Haitians | 0.0 /100 | #303 | Tragic $40,918 |
| Immigrants | Guatemala | 0.0 /100 | #304 | Tragic $40,851 |
Demographics Similar to Australians by Median Earnings
In terms of median earnings, the demographic groups most similar to Australians are Bhutanese ($52,297, a difference of 0.010%), Immigrants from Czechoslovakia ($52,361, a difference of 0.13%), Immigrants from Europe ($52,195, a difference of 0.19%), Immigrants from Malaysia ($52,514, a difference of 0.42%), and Bulgarian ($52,512, a difference of 0.42%).
| Demographics | Rating | Rank | Median Earnings |
| Israelis | 100.0 /100 | #40 | Exceptional $52,937 |
| Immigrants | Lithuania | 100.0 /100 | #41 | Exceptional $52,769 |
| Maltese | 100.0 /100 | #42 | Exceptional $52,526 |
| Immigrants | Malaysia | 100.0 /100 | #43 | Exceptional $52,514 |
| Bulgarians | 100.0 /100 | #44 | Exceptional $52,512 |
| Immigrants | Czechoslovakia | 100.0 /100 | #45 | Exceptional $52,361 |
| Bhutanese | 100.0 /100 | #46 | Exceptional $52,297 |
| Australians | 100.0 /100 | #47 | Exceptional $52,294 |
| Immigrants | Europe | 100.0 /100 | #48 | Exceptional $52,195 |
| Bolivians | 100.0 /100 | #49 | Exceptional $52,005 |
| Immigrants | South Africa | 100.0 /100 | #50 | Exceptional $51,850 |
| Immigrants | Austria | 99.9 /100 | #51 | Exceptional $51,826 |
| Estonians | 99.9 /100 | #52 | Exceptional $51,772 |
| Immigrants | Norway | 99.9 /100 | #53 | Exceptional $51,758 |
| Immigrants | Indonesia | 99.9 /100 | #54 | Exceptional $51,715 |