Liberian vs Immigrants from Senegal Median Earnings
COMPARE
Liberian
Immigrants from Senegal
Median Earnings
Median Earnings Comparison
Liberians
Immigrants from Senegal
$43,536
MEDIAN EARNINGS
1.7/ 100
METRIC RATING
254th/ 347
METRIC RANK
$45,611
MEDIAN EARNINGS
24.0/ 100
METRIC RATING
207th/ 347
METRIC RANK
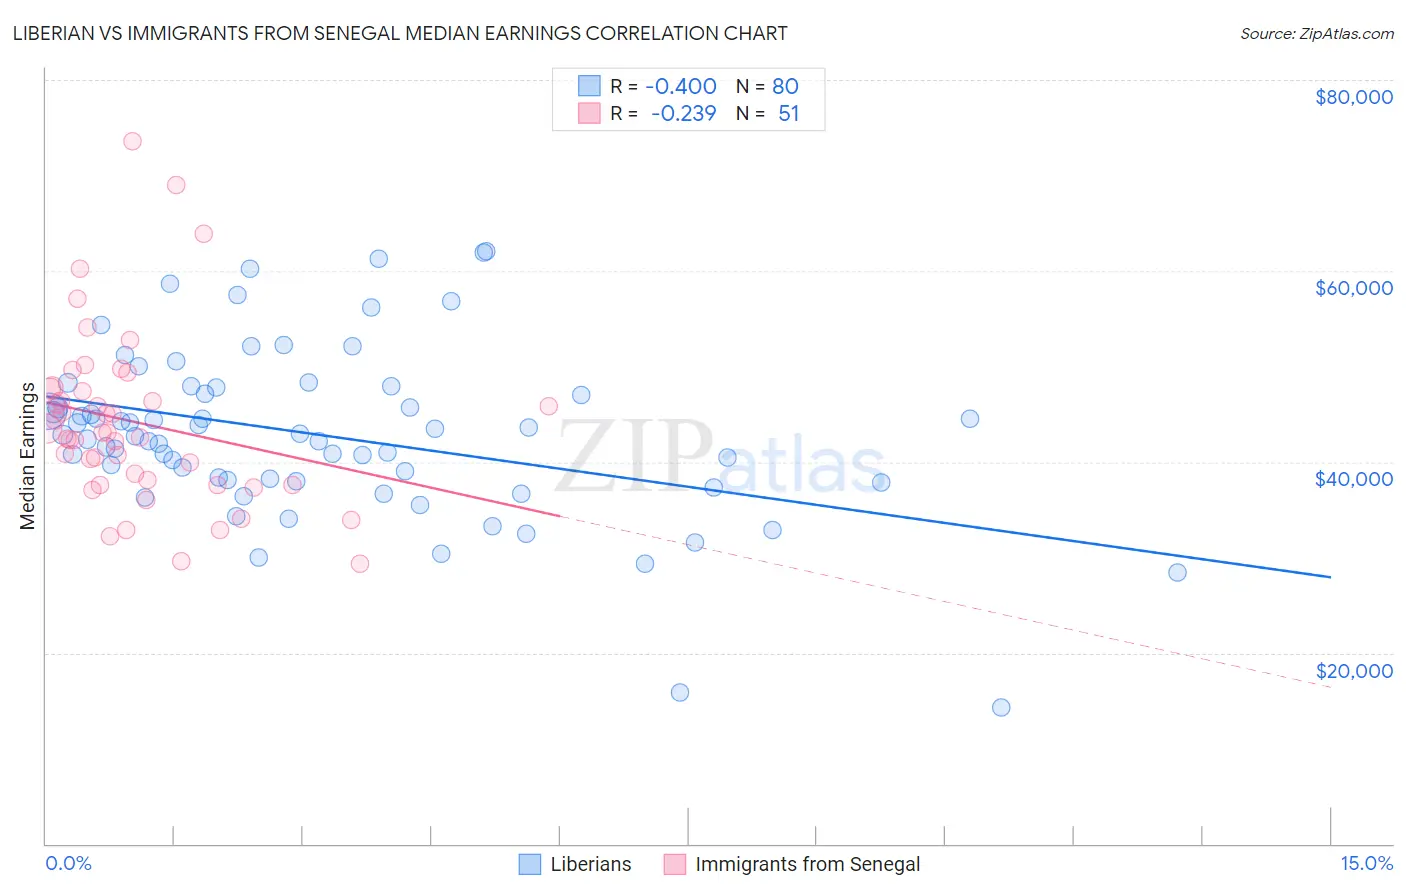
Liberian vs Immigrants from Senegal Median Earnings Correlation Chart
The statistical analysis conducted on geographies consisting of 118,107,140 people shows a mild negative correlation between the proportion of Liberians and median earnings in the United States with a correlation coefficient (R) of -0.400 and weighted average of $43,536. Similarly, the statistical analysis conducted on geographies consisting of 90,128,045 people shows a weak negative correlation between the proportion of Immigrants from Senegal and median earnings in the United States with a correlation coefficient (R) of -0.239 and weighted average of $45,611, a difference of 4.8%.
Median Earnings Correlation Summary
| Measurement | Liberian | Immigrants from Senegal |
| Minimum | $14,336 | $29,284 |
| Maximum | $62,030 | $73,618 |
| Range | $47,694 | $44,334 |
| Mean | $42,795 | $44,131 |
| Median | $42,751 | $43,043 |
| Interquartile 25% (IQ1) | $38,041 | $37,628 |
| Interquartile 75% (IQ3) | $47,442 | $47,719 |
| Interquartile Range (IQR) | $9,402 | $10,091 |
| Standard Deviation (Sample) | $8,910 | $9,098 |
| Standard Deviation (Population) | $8,855 | $9,008 |
Similar Demographics by Median Earnings
Demographics Similar to Liberians by Median Earnings
In terms of median earnings, the demographic groups most similar to Liberians are Somali ($43,567, a difference of 0.070%), Immigrants from Middle Africa ($43,416, a difference of 0.28%), Hawaiian ($43,673, a difference of 0.31%), Alaskan Athabascan ($43,393, a difference of 0.33%), and Tsimshian ($43,695, a difference of 0.37%).
| Demographics | Rating | Rank | Median Earnings |
| Immigrants | Cabo Verde | 3.0 /100 | #247 | Tragic $43,963 |
| Nepalese | 2.6 /100 | #248 | Tragic $43,860 |
| Malaysians | 2.6 /100 | #249 | Tragic $43,844 |
| Alaska Natives | 2.3 /100 | #250 | Tragic $43,750 |
| Tsimshian | 2.1 /100 | #251 | Tragic $43,695 |
| Hawaiians | 2.0 /100 | #252 | Tragic $43,673 |
| Somalis | 1.8 /100 | #253 | Tragic $43,567 |
| Liberians | 1.7 /100 | #254 | Tragic $43,536 |
| Immigrants | Middle Africa | 1.4 /100 | #255 | Tragic $43,416 |
| Alaskan Athabascans | 1.4 /100 | #256 | Tragic $43,393 |
| Jamaicans | 1.3 /100 | #257 | Tragic $43,343 |
| French American Indians | 1.3 /100 | #258 | Tragic $43,333 |
| German Russians | 1.1 /100 | #259 | Tragic $43,200 |
| Immigrants | Somalia | 0.9 /100 | #260 | Tragic $43,100 |
| Immigrants | Jamaica | 0.8 /100 | #261 | Tragic $43,026 |
Demographics Similar to Immigrants from Senegal by Median Earnings
In terms of median earnings, the demographic groups most similar to Immigrants from Senegal are Immigrants from Bosnia and Herzegovina ($45,600, a difference of 0.020%), Immigrants from Thailand ($45,598, a difference of 0.030%), Immigrants from Grenada ($45,596, a difference of 0.030%), Panamanian ($45,593, a difference of 0.040%), and Bermudan ($45,593, a difference of 0.040%).
| Demographics | Rating | Rank | Median Earnings |
| Immigrants | Azores | 29.5 /100 | #200 | Fair $45,812 |
| Celtics | 27.2 /100 | #201 | Fair $45,732 |
| Immigrants | Trinidad and Tobago | 27.1 /100 | #202 | Fair $45,729 |
| Welsh | 26.6 /100 | #203 | Fair $45,710 |
| Immigrants | Uruguay | 25.9 /100 | #204 | Fair $45,682 |
| Tongans | 25.4 /100 | #205 | Fair $45,665 |
| Immigrants | Ghana | 24.8 /100 | #206 | Fair $45,641 |
| Immigrants | Senegal | 24.0 /100 | #207 | Fair $45,611 |
| Immigrants | Bosnia and Herzegovina | 23.7 /100 | #208 | Fair $45,600 |
| Immigrants | Thailand | 23.7 /100 | #209 | Fair $45,598 |
| Immigrants | Grenada | 23.6 /100 | #210 | Fair $45,596 |
| Panamanians | 23.5 /100 | #211 | Fair $45,593 |
| Bermudans | 23.5 /100 | #212 | Fair $45,593 |
| Immigrants | Colombia | 22.4 /100 | #213 | Fair $45,550 |
| Nigerians | 22.0 /100 | #214 | Fair $45,532 |